Category Archives: Economics

Never Quit in the Middle of a Dip

Editor’s Note: For its fourth post, RealForecasts.com is re-publishing a white paper titled “Never Quit in the Middle of a Dip”, which was written in February of 2009. Whether you were in a Trap, on a Cliff or in a Dip during the last downturn — and whether you stuck or quit — this post can still help you to better prepare yourself for the inevitable next downturn.

Never Quit in the Middle of a Dip

Jeffrey J. Peshut

February, 2009

As the current real estate downturn continues, many real estate investors will feel pressure to divest themselves of their existing properties and portfolios — and even of the real estate asset class as a whole — to avoid further losses and pursue alternative investments that they perceive will provide superior risk-adjusted returns in the future. This pressure is sure to intensify the longer the real estate downturn lasts and will likely reach its peak at about the same time as the real estate market reaches its cyclical trough. This could lead many investors to sell at precisely the wrong time, locking in significant capital losses from which they may never recover.

This article suggests that real estate investors should never quit in the middle of a downturn or “dip”. Instead, they should ignore sunk costs, evaluate their investments prospectively and stick with the investment until the market recovers and they are once again in a position to enjoy the returns that investing in real estate is expected to provide over time.

When to Quit and When to Stick

Three curves help to both illustrate the types of situations that lead people to quit and explain why it is important to quit in some situations but stick it out in others. These three curves are “The Trap”, “The Cliff” and “The Dip”.

The Trap: “The Trap” describes situations in which we keep investing time, effort – and money – but nothing changes very much. Despite our best efforts, the situation doesn’t get much better and it doesn’t get much worse. It looks something like this:

The Trap

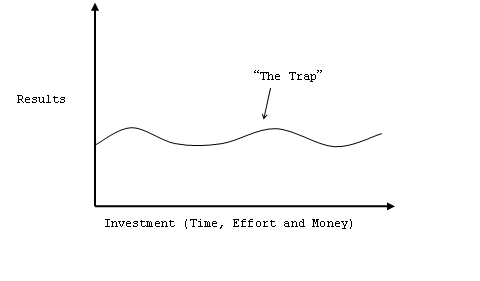
An example of The Trap in real estate investing is a property at which the increases in operating expenses and capital expenditures absorb most of the growth in rental rates. As a result, there is little if any capital appreciation at the property. Under a worse-case scenario, increases in operating expenses and capital expenditures exceed the growth in rental rates and the value of the property declines over time. Some have even referred to this type of property as a “value trap”.

The key to dealing with The Trap is first to recognize that we’re in one and then to get out of it as quickly as is reasonably possible. The opportunity cost of sticking with a situation that is unlikely to get better is too high.

The Cliff: “The Cliff” describes situations that involve a high degree of risk and a high cost of failure. At first, we get the results we want. Then, before we recognize it, we find ourselves staring into the abyss, with limited options to quit. As its name implies, it looks something like this:

The Cliff

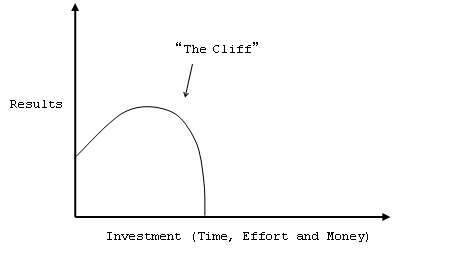
An example of The Cliff in real estate investing is a highly-leveraged property or portfolio that faces some type of default situation – whether a payment default, technical default (e.g., breach of a DSCR covenant) or term default. The default situation leads to either a forced sale at discounted pricing, a deed-in-lieu of foreclosure or a foreclosure. The ultimate result is a loss of most — and usually all — of the invested capital.

The key to dealing with The Cliff is similar to the key to dealing with The Trap – we need to recognize that we’re headed for one and – if it’s not too late – quit as quickly as is reasonably possible. Of course, the potential cost of staying on The Cliff is much greater than staying in The Trap. The potential cost of staying in The Trap is losing other opportunities. The potential cost of staying on The Cliff is losing our entire investment.

The Dip: “The Dip” describes situations in which our initial investment of time, energy and money provides the results we were expecting – often quickly and easily. Then, after a time, the expected results begin to wane. For those willing and able to push a little bit longer and a little bit harder than the rest, however, we not only find ourselves achieving the results we first expected, but extraordinary results well beyond that. (Extraordinary results also accrue to those who quit early and refocus their time and effort elsewhere, but that’s a separate topic for a separate discussion.)

Almost every situation in which it is worth investing our time, effort and money is illustrated by “The Dip”. We experience The Dip in school, in sports, in our relationships, in our careers and in our investing. See The Dip (New York: Penguin Group (USA) Inc., 2007). It looks something like this:

The Dip

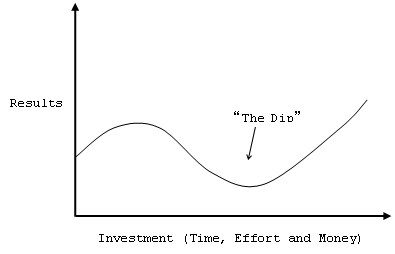
The Dip is so prevalent because most of the competitive systems we encounter are set up to encourage the many people who start to quit for the benefit of the few that stick it out. These systems are set up to “shake out the weak hands”. Quitting creates scarcity and scarcity creates value for the few that stick it out.

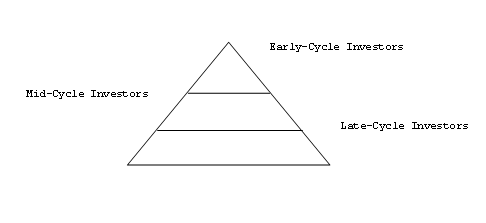
In effect, The Dip and these competitive systems are based upon various types of pyramid structures. As the Bernie Madoff situation reminds us, a pyramid structure is often a scam in which many people at the bottom support a few at the top. But a pyramid structure is not always a scam. In fact, we encounter it a lot more often than we realize.

For example, most private clubs are based upon a type of pyramid structure. Many people sign up for health clubs but very few use the club frequently after they join. This allows the operator to build a smaller facility and keep rates reasonable. The many members who join, but quit using it, support the few who join and do.

Similarly, NetFlix allows its customers to rent an unlimited number of DVDs each month for $8.99 per month, which includes postage. If someone watched a movie the day it came in and sent it right back, they’d get to watch at least six movies each month. Of course, for every customer that watches six, there are many more people who watch one movie — or even no movies — each month. Again, the many members who join but quit using it support the few who join and continue to use it.

Investment markets are also based upon a type of pyramid structure. Those who sell or quit during The Dip support those who invest during The Dip by providing them with the opportunity to enter the market at discounted pricing. The many who invest late in a market cycle also support the few who invested during The Dip by driving up values. Not surprisingly, these late-cycle investors are often some of the same investors who sold during the previous Dip. The investment market pyramid structure looks like this:

Stages of Cycle

An example of where we often see The Dip occur in real estate investing is a high-quality property in a prominent location in a first-tier submarket of a first-tier MSA — owned free and clear by a well-capitalized owner — that experiences a downturn in its local real estate market or the loss of a major tenant. Often, the two events occur simultaneously. As a result, the property’s cash flow and value decline. Depending upon the magnitude of the market downturn, it may take significant time, effort and money for the owner to work through The Dip. Ultimately, however, the market and property recover and the property’s cash flow and value begin to increase at an increasing rate, quickly exceeding the highest levels set prior to the downturn.

Having already discussed The Trap and The Cliff, it’s not too difficult to see how those of us experiencing The Dip might be fooled into believing that we are instead experiencing one of the situations that will ultimately lead to failure and, therefore, will feel pressure to give up or quit. Of course, the key to dealing with The Dip is being able to distinguish it from The Trap and The Cliff and then being able to stick with the situation long enough to get through it. If, however, we make the mistake of selling during The Dip, we will lock in our losses and provide the entry point at discounted pricing for one of the next market cycle’s “early” investors.

So it’s really very simple. Quit The Traps and The Cliffs and stick with The Dips. The hard part is distinguishing among the three and having the mental toughness to quit the first two and stick with the third.

Trap, Cliff or Dip?

Several key questions can help us to distinguish The Dip from The Trap or The Cliff:

  • What are the long-term population and job growth prospects for this MSA and Submarket? Has the market recovered from similar downturns in the past?
  • What is the property’s position within its submarket and competitive set? Is its market position improving or deteriorating? Are there steps we can take to maintain or improve it?
  • Do we own the property free and clear or is it subject to debt financing? If subject to debt financing, can we forecast a scenario that will lead to a payment, technical or term default?
  • Do we have the capital resources necessary to fund capital expenditures or to restructure the capital stack to head off a potential default?

The better the MSA, the Submarket, the property’s market position and our capital resources, the more likely we are experiencing The Dip and not The Trap or The Cliff.

Sticking With The Dip

It’s human nature to quit when it hurts. Short-term pain has more of an impact on the average person than long-term gains do. The key to sticking with an investment through The Dip is to rise above the short-term pain and stay focused on the long-term gain when others are losing sight of it. We should never quit something with great long-term potential just because we’re having difficulty coping with the discomfort of the moment.

It’s also important to recognize that it’s the difficult challenges – The Dips – that provide us with opportunities to pull ahead of our competitors. In a competitive market environment, adversity is actually our ally. The harder it gets, the better our chances of differentiating ourselves from the competition. If adversity causes us to sell or quit an investment in the middle of The Dip, we’ve not only squandered a great opportunity, we’ve likely passed that opportunity along to one of our competitors.

One technique that will help us to stick with an investment through The Dip is to write down in advance the circumstances under which we will quit — and when. We should then stick with the investment unless these circumstances come to pass. Developing an exit strategy as part of our initial underwriting process will provide us with invaluable perspective if we find ourselves in a painful situation, frustrated or stuck.

Summary

We’ve seen that sticking with The Dip leads to extraordinary results, whereas sticking with The Trap or The Cliff leads to failure. In the case of The Cliff, that failure can be catastrophic. We’ve also discussed ways to recognize whether we’re in The Dip or The Trap, or on The Cliff, and to overcome short-term pain to realize long-term gains by quitting The Traps and The Cliffs and sticking with The Dips. In other words, as the title of this article correctly states, we should never quit in the middle of a Dip.

Is There A Real Estate Bubble?

Editor’s Note: This is the second post for RealForecasts.com. For its second post, RealForecasts.com is re-publishing a white paper titled “Is There a Real Estate Bubble?”, which was written in September of 2005. Not only were there were bubbles in both the residential and commercial real estate capital markets, but the bursting of these bubbles that began in August of 2007 precipitated the greatest economic downturn in the U.S. since The Great Depression of the 1930s.

Is There a Real Estate Bubble?

By Jeffrey J. Peshut

September, 2005

The question on the minds of most real estate investors today is whether there is a “bubble” in the real estate capital markets and, if so, when will it “burst”. I wrote the [previous post titled “Will Market’s Boom/Bust Cycle Repeat?”] in mid-1998. The question then was whether there was a bubble in the stock markets and economy and, therefore, the real estate space markets. Hindsight tells us that there was in fact a bubble in all three, as these bubbles burst about 18 months later.

Is There A Bubble?

Those who argue that there are bubbles in both the residential and commercial real estate capital markets today make the following case:

– We are once again nearing the end of a “credit-fueled” bubble similar to the credit-fueled bubbles that ended during the late 1980’s and late 1990’s.

– The Federal Reserve and commercial banks cause these bubbles by artificially expanding the supply of money and credit. The Fed expands the supply of money and credit by buying Treasury Bills in the open market or by lowering the discount rate as a means of lowering short-term interest rates. This expansion of the money base is magnified by the impact of fractional-reserve banking.

– When the Fed pumps money into the economy, interest rates drop — at least at first.

– As the commercial banks’ reserves increase and interest rates decrease, businesses take out bank loans to invest in projects that weren’t profitable at the higher interest rates previously set by the free market. As businesses hire workers and buy equipment and raw materials to implement their investment plans, the economy picks up and the boom phase of the cycle begins.

– The boom, however, is founded upon an illusion. The government appeared to enlarge the pool of savings available for businesses to invest, but in reality it created money that didn’t exist before. It’s this money that was created “out of thin air” that creates the bubble.

– After all, the government can’t create wealth or real savings. It can only confiscate and redistribute existing wealth through taxation or inflation. When the Fed reduces interest rates by inflating the money supply, it in effect confiscates part of our wealth by inflation and lends our money to borrowers at the below-market rates referenced above.

– This subsidized interest rate sends a false signal to businesses, encouraging them to invest in projects that consumers weren’t in fact willing to pay for.

– Alas, all credit-fueled bubbles must end. Otherwise, we risk hyper-inflation or a collapse in the value of the dollar relative to other currencies.

– To end the bubble, the Fed must reverse its earlier policy and contract the supply of money and credit.

– During the late 1980’s, concerns about the rate of inflation for goods and services and a weak dollar lead the Federal Reserve to drastically tighten credit and end the bubble. During the late 1990’s, “irrational exuberance” in the stock market led the Fed to tighten credit and end that bubble. Today, concerns about a “housing bubble” and a weak dollar seem to be the impetus behind the Fed’s increasingly tight monetary policy.

– When credit-fueled bubbles end, they burst. And when they burst, the ill-advised investments that businesses made during the period of the Fed’s loose monetary policy are exposed.

According to this line of thinking, the question of whether the “bubble” in the real estate capital markets will “burst” becomes not “if” but “when”. And once it does, by “how much” will values decline.

If So, When Will It Burst?

To attempt to answer the “when” question, I offer the following observations:

– During the last “credit-fueled” bubble, the rate of growth in the money supply reached its peak in mid-1998 and its trough in late-2000. This correlates closely with the Fed’s “loose” monetary policy from early-1995 through early-1999 and its “tight” monetary stance from early-1999 through late-2000. See the following [Fed Funds Rate and REAL Money Supply (RMS) graphs. See also “The Mystery of the Money Supply Definition” by Frank Shostak (The Quarterly Journal of Austrian Economics Vol. 3, NO. 4 (Winter 2000): 69–76.) REAL Money Supply represents the true definition of the money supply outlined in Dr. Shostak’s article.]

Fed Funds Rate 1975 - 2005

REAL Money Supply 1975-2005

– During what is arguably the most recent “credit-fueled” bubble, the rate of growth in the money supply reached a peak in early-2002 and again in early-2004, before beginning its current descent. Again, this correlates closely with the Fed’s loose monetary policy from late-2000 through early-2004 and its tight monetary stance since early-2004. It also correlates closely with the most recent run-up in prices in the residential and commercial real estate capital markets.

– Recently, [RMS has] been increasing at a decreasing rate. “Real [RMS]” ([RMS] adjusted for price inflation) correlates closely with changes in Industrial Production – a key measure of economic activity — with a 12-month lag. “Adjusted [RMS]” ([RMS] adjusted for price inflation and economic activity) correlates closely with changes in the stock markets, with a 4-month lag.

If past is prologue, the effect of the Fed’s current tight monetary stance on the money supply’s growth rate creates a significantly heightened risk of a slowdown in economic activity, a correction in the stock markets and a correction in the real estate capital markets in the year ahead.

How Much Will Values Decline?

With respect to the question of “how much” values will decline, the following observations are noteworthy:

– From 1995 through 2004, the spread between going-in cap rates and the 10-year Treasury averaged 320 bps.

– A year ago, going-in cap rates and 10-year unlevered IRR’s were 7.0% to 7.5% and 8.25% to 8.75%, respectively. These going-in cap rates represented a spread of approximately 280 to 330 bps over the 10-year Treasury, consistent with the historical average.

– Today, going-in cap rates and 10-year unlevered IRR’s are 5.75% to 6.25% and 7.0% to 7.25%, respectively, for “core” real estate investments. The going-in-cap rate represents a spread of approximately 155 to 205 bps to today’s 10-year Treasury.

– This spread is not only narrow for cap rates, but would also be narrow for commercial mortgage spreads. From 1996 through year-to-date 2005, the spread between commercial mortgages and the 10-year Treasury averaged 190 bps.

– According to L.J. Melody, today’s rates for fixed-rate commercial mortgages are 4.9 % to 5.5% for the four major property types. These rates represent a spread of 70 to 130 bps over the 10-year Treasury, approximately half the historical average.

– Therefore, it appears that last year’s cap rate levels were sustainable based upon historical averages but that the 125 bps decline in cap rates and IRR’s during 2005 will prove to be unsustainable.

– For a property with NOI of $5 million, a 125 bps increase in today’s going-in cap rates would result in a decline in value of 17% to 18%. It is important to note that this decline in value reflects only a return of the going-in cap rate spread to its historical average. It does not reflect a change in the 10-year Treasury rate.

– It is also important to note that a 17% to 18% decline in value requires a 20% to 22% increase in value to return to the value that existed before the decline.

One final observation: Once bubbles burst and market values decline, market values typically take a long time to recover. For example, five years after the bubbles in the stock markets burst, the Dow Jones Industrial Average is still only 90% of the all-time high it set in early-2000. Similarly, the S&P 500 Index and the NASDAQ Composite Index are only 80% and 45%, respectively, of their 2000 all-time highs. Therefore, once the real estate bubble bursts, it could take several years before real estate values return to the levels they achieved at the height of the bubble.

Will Market’s Boom/Bust Cycle Repeat?

Editor’s Note: This is the inaugural post for RealForecasts.com. For its first post, RealForecasts.com is re-publishing an article titled “Will Market’s Boom/Bust Cycle Repeat?”, which appeared in the June 17-June 30, 1998 edition of the Colorado Real Estate Journal. Today, we know the answer to the question posed by the article. The market’s boom/bust cycle did repeat — a mere 18 months later.

Will Market’s Boom/Bust Cycle Repeat?

By Jeffrey J. Peshut

June, 1998

Contrary to recent media reports, the pending sale of Miller Global Holdings’ eight-building metro Denver office building portfolio to Chicago-based Equity Office Properties LLC for $394 million will not be the largest commercial real estate transaction in Colorado history. That honor goes to a transaction completed in the early-1980s by Miller, Klutznick, Davis and Gray, another Miller-led organization.

Denver real estate veterans will recall that MKDG sold the 3-million square foot City Center complex to Prudential’s “PRISA” fund for $500 million in 1983-1984. Completed at the apex of an unprecedented economic and real estate boom, the sale included buildings known today as Johns Manville Plaza (f/k/a Petro Lewis Tower), MCI Tower (f/k/a ARCO Tower), First Interstate Tower North, 1801 California Street (f/k/a City Center IV) and the 615-room Marriott Hotel.

Within less than two years of MKDG’s sale to Prudential, however, Denver’s economy and real estate market descended into one of the worst bust cycle’s in the city’s history.

The question for market watchers today is whether Miller Global Holdings’ sale to Equity Office Properties signals the top of this market cycle or whether the sale is the harbinger of a “new era” that is immune from the boom/bust cycles that have plagued the Denver economy and real estate market in the past.

A New Era

Those who believe we are entering a new era — where the old rules no longer apply — advance a number of arguments in favor of their view.

With respect to the national economy, they argue that the break up of the Soviet Union and the end of the Cold War freed up investment capital for productive uses, instead of being frozen in non-productive military uses. They say that this new capital has, in turn, been leveraged by advances in computer technology, creating unprecedented increases in productivity, low unemployment and low inflation.

Nowhere is this more apparent than in Colorado. Today, the state’s unemployment hovers just above 3 percent, with moderate inflation of only 3.4 percent.

Further, most business leaders believe that the state’s over-reliance on the energy industry caused the deep recession of the late 1980s. These leaders now point to a more diverse economy as the primary reason why a sharp economic downturn will not recur.

Real estate pundits also argue that the massive overbuilding of the 1980s was caused by a combination of the savings and loans — and other financial institutions — eager to make loans and passive tax laws that offered developers incentives for building. They point out that neither condition exists today.

They say that even though 1997 saw a sharp increase in the amount of speculative construction in both the office and industrial categories, it pales in comparison to the amount of build-to-suit construction. Industry insiders also argue that the emphasis on “modular” low-rise and mid-rise developments — as opposed to the high-rise developments of the 1980s — will help ensure that the supply of speculative office space will not significantly outpace tenant demand.

Sign of a Market Top

Those who view the Miller Global/Equity Office transaction as the sign of a market top argue that we are once again nearing the end of a “credit-fueled” economic expansion, similar to the credit-fueled expansion that ended during the mid-to-late 1980s. They believe that the Federal Reserve and commercial banks cause unending boom/bust cycles by artificially expanding — and later contracting — the supply of money and credit.

The Federal Reserve expands the supply of money and credit either by buying Treasury Bills in the open market or by lowering the discount rate as a means of lowering short-term interest rates.

As short-term interest rates fall, commercial banks tend to make more loans to both businesses and consumers. And when banks make more loans, they essentially create money that didn’t exist before. As businesses and consumers spend this borrowed money, the economy expands.

This scenario describes what occurred in the U.S. economy during the early-to-mid 1980s. Many argue that this also describes what happened in the U.S. economy during the past several years.

As with all good things, however, economic expansions too must come to an end. Like a fire, they either burn themselves out from lack of fuel or are put out by the Fed before the rage out of control.

During the mid-to-late 1980s, concerns about the rate of inflation for goods and services, and a weak dollar, led the Fed to drastically tighten credit and thus “put out” that economic expansion. It is too soon to tell whether concerns about the rate of inflation — for goods, services or financial assets — will lead the Fed to put out this expansion. Or whether the Fed will allow this expansion to “burn out” on its own.

Irrespective of how it will end, proponents of this view argue that the volume and profile of investment capital flowing into Denver real estate suggests that the current economic expansion and real estate boom will end in the near-to-mid term, especially if they look at how real estate marketing software can help to get agencies and realtors back on their feet. And what better way than to market yourselves to potential clients, buyers, and sellers. In the meantime though, consider the following points:

  • Money Supply. First, in most business cycles, the growth in money accelerates as the business cycle matures. An accelerating growth in the money supply certainly explains the accelerating flow of investment capital into Denver real estate.
  • David and Goliath. Further, despite outward appearances to the contrary, hordes of small “retail” investors are replacing a handful of “high net worth” investors as owners of a preponderance of Denver’s investment grade commercial real estate. Often, the arrival of the “little guy” signals the arrival of a market top.

This brings us back to the potential significance of the Miller Global/Equity Office sale. Just as Prudential’s “PRISA” fund acquired City Center from MKDG on behalf of the small pension fund investor in 1983-1984, Equity Office Properties is acquiring Miller Global Holdings’ portfolio on behalf of the small REIT investor in 1998. While the investment vehicle may be different, the profile of the ultimate investor remains the same.

Conclusion

It is human nature to forecast or project into the future in a linear fashion. Unfortunately, it is this propensity to project “linearly” that causes markets to behave “cyclically”.

Thus, the question of whether the boom/bust cycle will repeat becomes not “if?” but “when?” And once it does, for “how long?”