Editor’s Note: For its sixth post, RealForecasts.com is re-publishing a white paper titled “The Impact of Federal Reserve Policy on the Multi-family Sector”, which was written in March of 2010 and distributed by ING Clarion Partners to institutional investors and consultants.
Although the Fed stopped purchasing agency debt and MBS coincident with the end of QE1 in March of 2010, it resumed its purchases with the commencement of QE2 in November of 2010 and continued purchases through the end of QE2 in June of 2011. These continued purchases further bolstered multi-family lending and capital values and forestalled the risk of reversal in the multi-family property market that was raised by this paper.
The Fed’s third round of quantitative easing (QE3) began in September of 2012. Unlike QE1 and QE2, QE3 does not have a defined timeframe and will reportedly continue until the employment market improves. Combined with purchases of long-term Treasuries under “Operation Twist”, which is designed to drive down long-term interest rates, since September of 2012 the Fed has been buying $85 billion of assets per month.
The Impact of Federal Reserve Policy on the Multi-family Sector
Jeffrey J. Peshut, M. Gregory Chicota, David J. Lynn, PhD, Tim Wang, PhD, Bohdy Hedgcock
March, 2010
Executive Summary
We believe that the Federal Reserve’s explicit support for housing-related government-sponsored enterprises (GSEs) — Fannie Mae, Freddie Mac, Ginnie Mae, and the Federal Home Loan Banks – has helped avert a more severe fall in housing values. It has also helped to bolster multi-family lending and capital values. This support appears to be waning, however, as the Fed has announced an end to the programs in March. This policy shift will likely impact the availability and cost of debt for multi-family properties, which may have a spillover effect on property valuations.
Overview
In November of 2008, the Federal Reserve announced a $600 billion program to purchase the direct obligations of housing-related GSEs — Fannie Mae, Freddie Mac, and the Federal Home Loan Banks — and mortgage-backed securities (MBS) guaranteed by Fannie Mae, Freddie Mac, and Ginnie Mae. According to the Fed, the action was taken to reduce the cost and increase the availability of credit for the purchase of houses, which was expected to support housing markets and foster improved conditions in financial markets more generally.
Purchases of up to $100 billion in GSE direct obligations under the program were to be conducted with the Federal Reserve’s primary dealers through a series of competitive auctions. Purchases of up to $500 billion in MBS were to be conducted by asset managers selected via a competitive process. Purchases of both direct obligations and MBS were expected to take place over several quarters.
Purchases of up to $100 billion in GSE direct obligations under the program were to be conducted with the Federal Reserve’s primary dealers through a series of competitive auctions. Purchases of up to $500 billion in MBS were to be conducted by asset managers selected via a competitive process. Purchases of both direct obligations and MBS were expected to take place over several quarters.
In December of 2009, the Treasury Department quietly announced that instead of limiting its support to the GSEs to the previously-announced $600 billion, its support would be unlimited for the next three years.
Since the original program was announced in November of 2008, the Federal Reserve has actually purchased $152.4 billion of Federal agency debt securities and $970.3 billion of mortgage-backed securities guaranteed by Fannie Mae, Freddie Mac and Ginnie Mae. The Fed said last month it will stop buying agency debt and MBS at the end of March. By then, the Fed plans to have bought about $175 billion worth of agency debt and $1.25 trillion worth of mortgage-backed securities.
GSE Share of Residential Mortgage Loans
The GSEs hold the largest share of single-family residential mortgages and home loans, including $5.1 trillion of loans that support the mortgage-backed securities they have issued and $446.4 billion of “whole” loans in their own portfolios. Combined, they account for approximately $5.5 trillion or 51% of the almost $10.9 trillion of single-family mortgage debt outstanding in the U.S. They are followed by Commercial Banks with $2.2 trillion (20%), Asset-Backed Securities issuers with $1.6 trillion (15%), Savings Institutions with $537.4 billion (4.9%), Finance Companies with $345.1 billion (3.2%) and Credit Unions with $318.4 billion (2.9%) (Figure 1).
The GSEs also hold the largest share of multi-family mortgage loans, with $197.4 billion of “whole” loans in their own portfolios and $162.2 billion of loans that support the mortgage-backed securities they have issued. Combined, they account for $359.6 billion or 39% of the $911.7 billion of multi-family residential mortgage debt outstanding. They are followed by Commercial Banks with $217 billion (24%), Asset-Backed Security issuers with $110 billion (12%), State and Local Governments with $66 billion (7%), Savings Institutions with $64 billion (7%) and Life Insurance Companies (6%) (Figure 2).
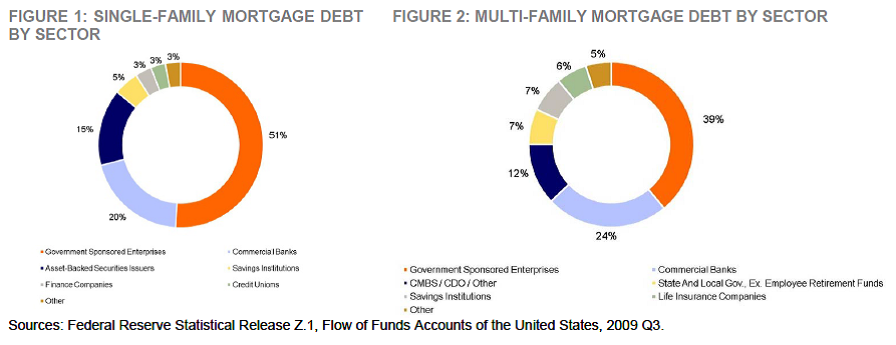
It is worth noting that the amount of single-family residential mortgage debt outstanding greatly exceeds the amount of multi-family residential mortgage debt outstanding, with multi-family mortgages representing only 7.7% of all residential mortgage debt outstanding. More importantly for this analysis, GSE single-family residential mortgage debt outstanding dwarfs the amount of GSE multi-family residential mortgage debt outstanding, with GSE multi-family mortgages representing only 6.5% of all GSE residential mortgage debt outstanding.
Multi-Family Debt Outstanding, Interest Rates and Equity Returns
While the Fed’s program was designed to hold down home loan costs and stimulate the economy, research suggests that it has had the ancillary effect of increasing the availability and reducing the cost of credit for the purchase of multi-family residential properties. This in turn has slowed the rate of increase in the Income Return for NCREIF’s multi-family property sector — a proxy for capitalization rates (cap rates) — compared with NCREIF’s other property sectors.
From the end of the third quarter of 2008 through the end of the third quarter of 2009, a period which encompasses the Fed’s program, GSE multi-family residential mortgage debt outstanding increased by 9.5% (Figure 3).
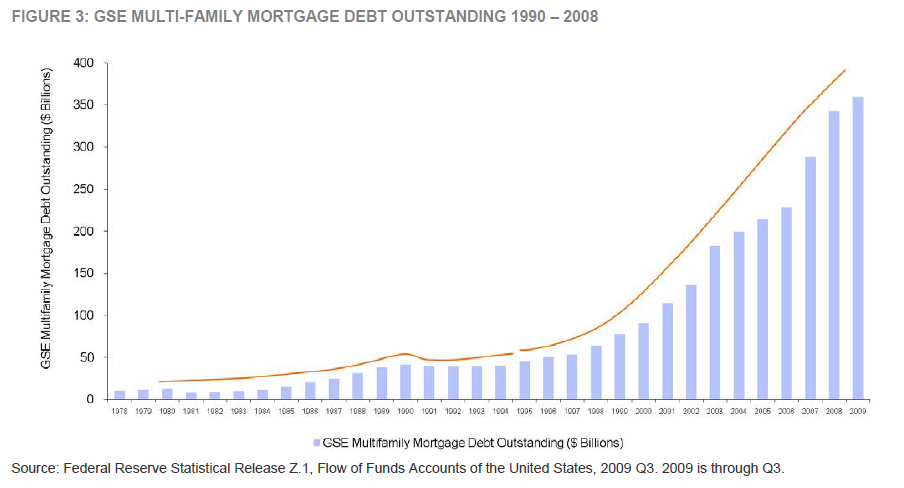
During the same four quarters, all multi-family residential mortgage debt outstanding increased by only 1% and commercial mortgage debt outstanding decreased by 1%.
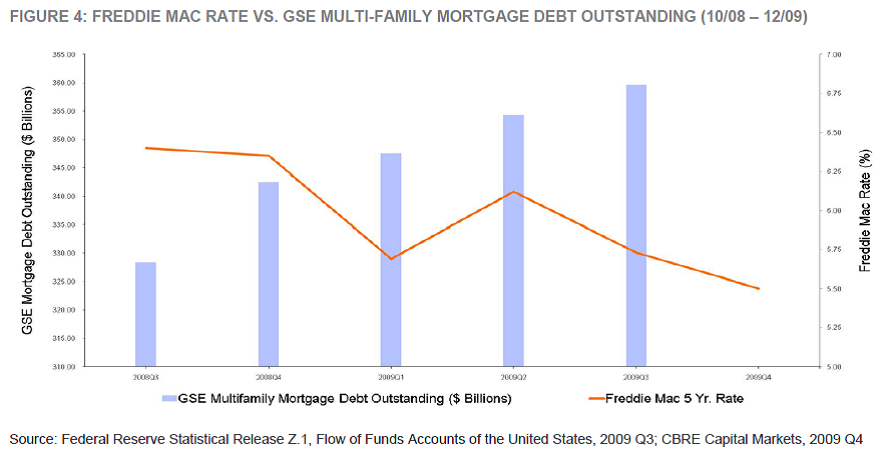
As the outstanding GSE multi-family residential mortgage debt increased from the end of the third quarter of 2008 through the end of the fourth quarter of 2009, the cost of that debt decreased, with the interest rate on Freddie Mac’s 5-year fixed-rate loans declining by 90 bps, from 6.4% to 5.5% (Figure 4).
From the end of the third quarter of 2008 through the end of the third quarter of 2009, the Income Return for the NCREIF Apartment Sector increased 88 bps from an historic low of 4.45% to 5.33% (Figure 5).
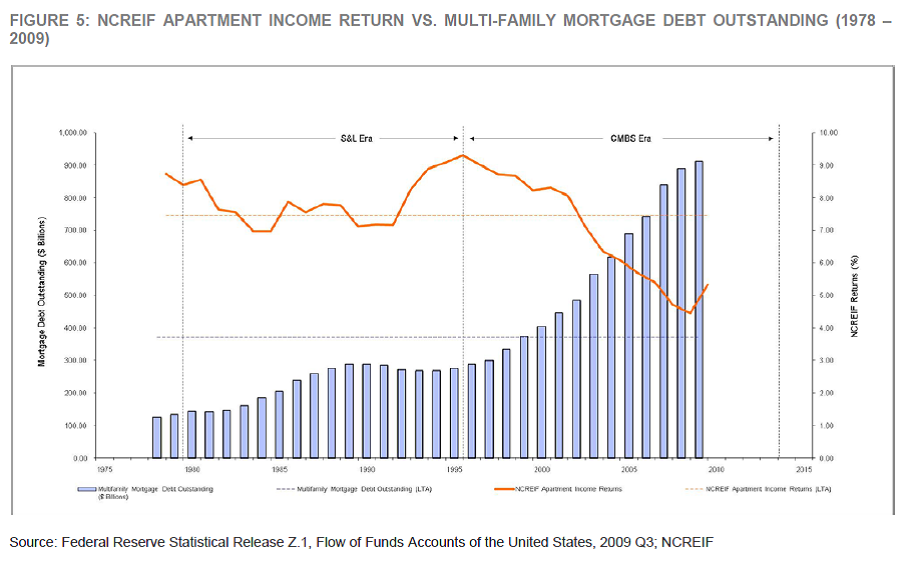
This increase is less than the 116 bps increase in the combined Income Return for NCREIF’s Office, Retail and Industrial property sectors for the same period and would seem to reflect the impact of the increased availability and reduced cost of GSE debt on the Apartment sector.
Example From A Recent Transaction
A recent transaction highlights the impact of the increased availability and the lower cost of GSE debt for the multi-family sector. City Pointe is a five-story 183-unit apartment property that is well-located in downtown Fullerton, CA.
The property is subject to a $24,000,000 Freddie Mac floating rate loan that the seller recently put in place at a spread of 311 basis points over Freddie Mac’s Reference note, which is currently at 0.1%. This results in a highly-favorable current rate of 3.21%. The loan includes a 7% interest rate cap, a 5-year term, and can be paid off with a 1% penalty at anytime after November 2010.
Widely marketed by CBRE, the offering generated 50 property tours and 27 offers. About one-third of the offers exceeded $40 million. The bidders that submitted above $40 million included REITs, private buyers and exchange buyers. The property is expected to trade for approximately $42 million, which translates into an implied going-in cap rate of 5.25% on the nominal underwriting assumptions. On more realistic assumptions, we believe the expected purchase price will represent a going-in cap rate of approximately 4.9%.
Investment Implications
The analysis presented in this paper suggests that the Federal Reserve’s program to purchase the direct obligations of housing-related GSEs has increased the amount of GSE multi-family mortgage debt outstanding, lowered the interest rates on these mortgages and slowed the increase in income returns — and decrease in value — for multi-family properties. With the Fed’s recent announcement (January 2010) that it will stop buying agency debt and MBS at the end of March, it is reasonable to conclude that we may see a moderation in the positive effects on multi-family pricing. Combined with Federal Reserve Chairman Bernanke’s statement to the Financial Services Committee (February 13, 2010) about the Fed’s strategy for winding down the extraordinary lending and monetary policies that it implemented to combat the financial crisis, there is a greater risk that recent capital market trends for the multi-family property sector could reverse.
These considerations imply that current market conditions are providing a window of opportunity for multi-family residential owners to sell assets – whether to realize gains that have accrued to them over the past several years, pay down debt or increase liquidity. Surprisingly, the NCREIF Apartment Income Return is still only 88 bps above its all-time low.
Although the current economic and real estate market environment makes finding attractive multi-family investment opportunities difficult, prospective buyers should focus on properties characterized by strong and sustainable operating fundamentals – occupancy, rental rates, income and cash flow – that will offset the potential for cap rate decompression as the Fed’s support for the GSEs wanes.