By Jeffrey J. Peshut
January 14, 2014
On Monday, January 6th, the U.S. Senate confirmed Janet Yellen as the next Chair of the Board of Governors of the Federal Reserve System. Yellen will take over the role from current Chair Ben Bernanke, whose term ends on January 31, 2014. Yellen will also take over Bernanke’s role as Chair of the Federal Open Market Committee (FOMC), the Fed’s primary monetary policymaking body.
Many have lauded Bernanke for his astute leadership of the Fed as it helped to avert a meltdown of the U.S. economy in 2008 and 2009 and put it back on the path to recovery — as slow and modest as it has been. Proponents of Austrian Business Cycle Theory, on the other hand, argue that the Fed actually creates the business cycle by artificially expanding the supply of money and credit, lowering interest rates below their market or “natural” level and thereby creating an unsustainable economic boom which inevitably results in a bust. They contend that giving Bernanke and the Fed credit for averting an economic meltdown is akin to giving an arsonist credit for putting out a fire that they set in the first place and creating favorable conditions for the next fire!
Austrian Business Cycle Theory
Thomas E. Woods, Jr., a senior fellow at the Ludwig von Mises Institute (www.mises.org) and best selling author, provides a succinct explanation of Austrian Business Cycle Theory, which I will attempt to replicate here. Echoing Nobel Prize-winning economist Friedrich Hayek, Woods begins his explanation by asserting that interest rates play an important role in a free market economy — they coordinate production over time. When we save more of our income, and interest rates consequently decrease, we send a signal to businesses to produce goods and invest in projects that are going to bear fruit in the future. Because long-term projects are more interest rate sensitive, lower interest rates provide an incentive to businesses to invest in them. Also, when we save more of our income today, we are implicitly saying that we are going to consume more in the future. It’s that future consumption that businesses are investing for today.
Furthermore, when we save more of our income and don’t consume all of the resources that we could today, the unconsumed resources remain available in the economy and provide the material wherewithall to produce future goods and complete longer-term projects. In the Austrian vernacular, the pool of real savings has increased.
Conversely, when we consume more of our income today and save less, and interest rates increase, we send a signal to businesses to produce goods and invest in projects that are going to bear fruit today. Higher interest rates provide a disincentive for businesses to invest in long-term projects. Also, when we consume more today, we will have less available for consumption in the future. With higher interest rates and less future consumption, businesses invest in the production of fewer future goods and fewer long-term projects. Consumers prefer to consume today versus the future and businesses prefer to produce for today versus the future.
When we save less and consume more today, we leave fewer resources available to produce future goods and complete long-term projects. The pool of real savings hasn’t increased and could, theoretically, even decrease.
In either case, if interest rates are allowed to achieve market or “natural” levels and to coordinate production over time, the resulting economic growth is sustainable and there is no boom/bust cycle. If, however, some exogenous force tampers with the structure of interest rates that would otherwise be set by the market, they can no longer serve their coordinating function. “Dis-coordination” is introduced into their coordinating function.
Consequently, if a central bank like the Federal Reserve decides to force interest rates down through its open market operations, it sends a misleading signal to businesses about consumers’ true time preferences. As the Fed drives down interest rates, businesses are led to believe that consumers are saving more today to consume more in the future and that now is the time to take advantage of the lower interest rates and invest in longer-term production projects for new products in the future. In fact, consumers haven’t said that they want to save more today and consume more in the future. They may want to continue to consume the same amount as the have been consuming. They may even demand more of existing goods.
Similarly, just because the Fed has decided to force interest rates down, it doesn’t mean that consumers have released more resources into the economy to complete future production capacity and future production. As suggested above, people may not only prefer to continue to consume the same amount of resources today, they may want to consume even more. This creates an unchanged or even shrinking resource pool from which to fund a growing number of new investment projects.
Something has got to give. The boom in economic growth precipitated by the artificial creation of money and credit and lower interest rates is not sustainable. The bust is inevitable. The bust may occur because businesses incorrectly forecasted future consumer demand for the future supply of their products. As a result, these projects will become unprofitable. It may also occur because businesses incorrectly forecasted the availability of resources from which to complete their future projects and they won’t be able to complete them. It can even occur because the Fed decides to reverse its monetary policy — from a “loose” policy stance to a “tight” policy stance — based upon a concern about how the increase in the money supply will affect consumer prices, asset prices or the price of the dollar relative to other currencies. But occur it must.
Once the bust occurs, the solution is to stop the money creation, allow the market to liquidate the unsustainable projects or “malinvestments”, allow interest rates to return to their natural levels and thereby allow the economy to return to health.
Empirical Data
One way to test the Austrian Business Cycle Theory is to determine whether the empirical data from the Fed’s policy decisions create the boom and bust conditions in the economy that the Theory suggests. Figure 1 illustrates that the five credit crises and four recessions that have occurred in the U.S. economy since 1975 were all preceded by a period of loose monetary policy, with a corresponding sharp decrease in the Fed Funds Rate, followed by a period of tight monetary policy, with a corresponding sharp increase in the Fed Funds Rate. A boom period followed by a bust.
Figure 1: Fed Funds Rate 1975 – 2013
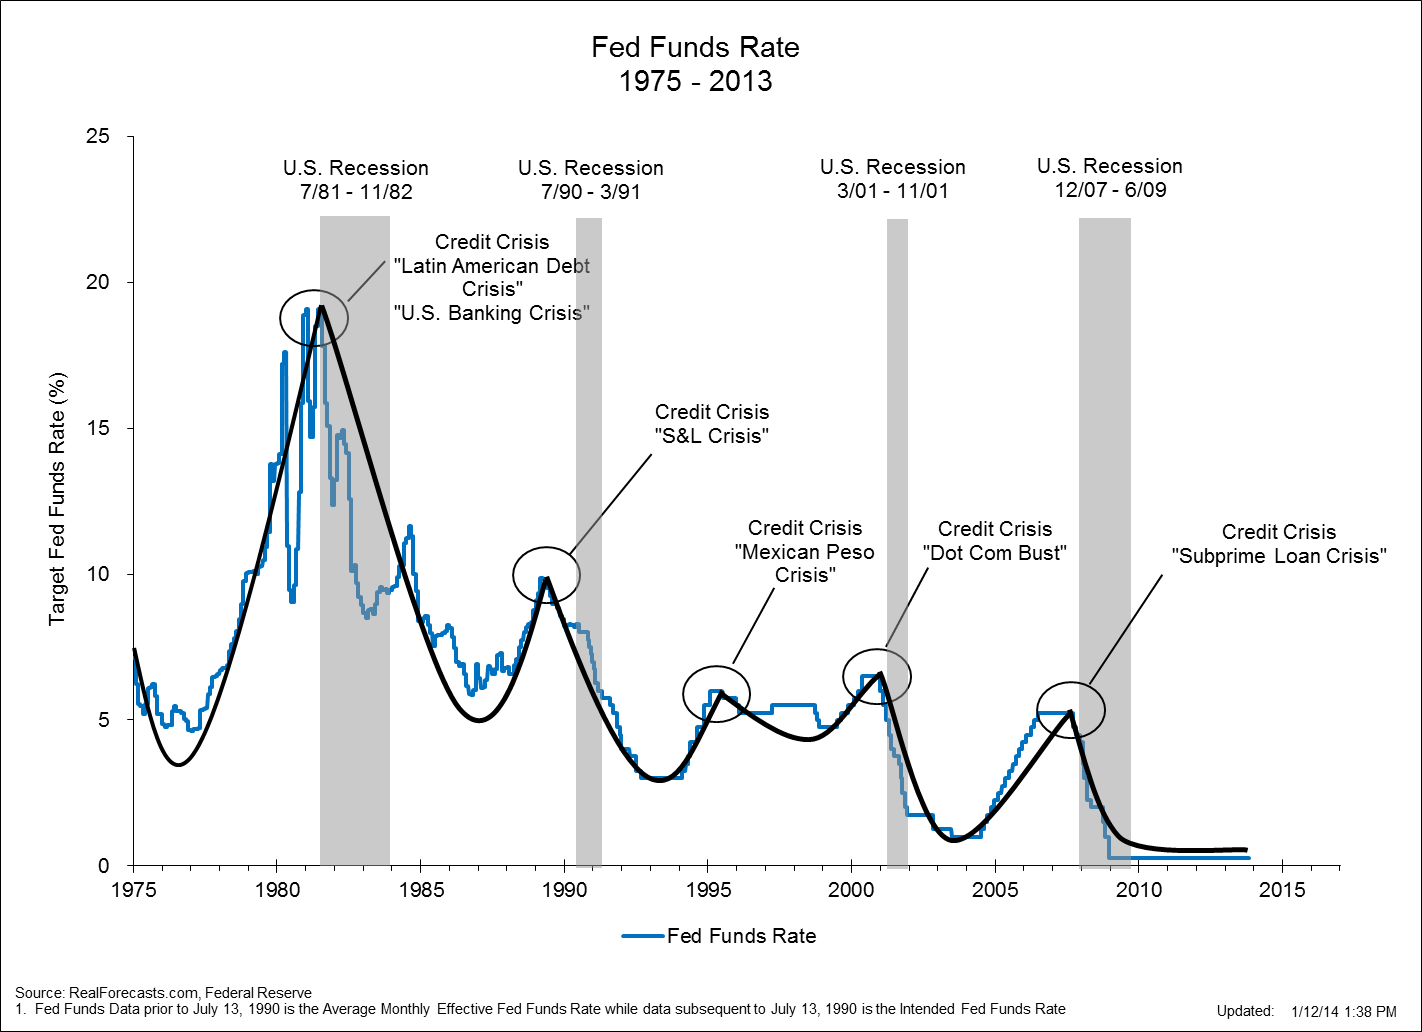
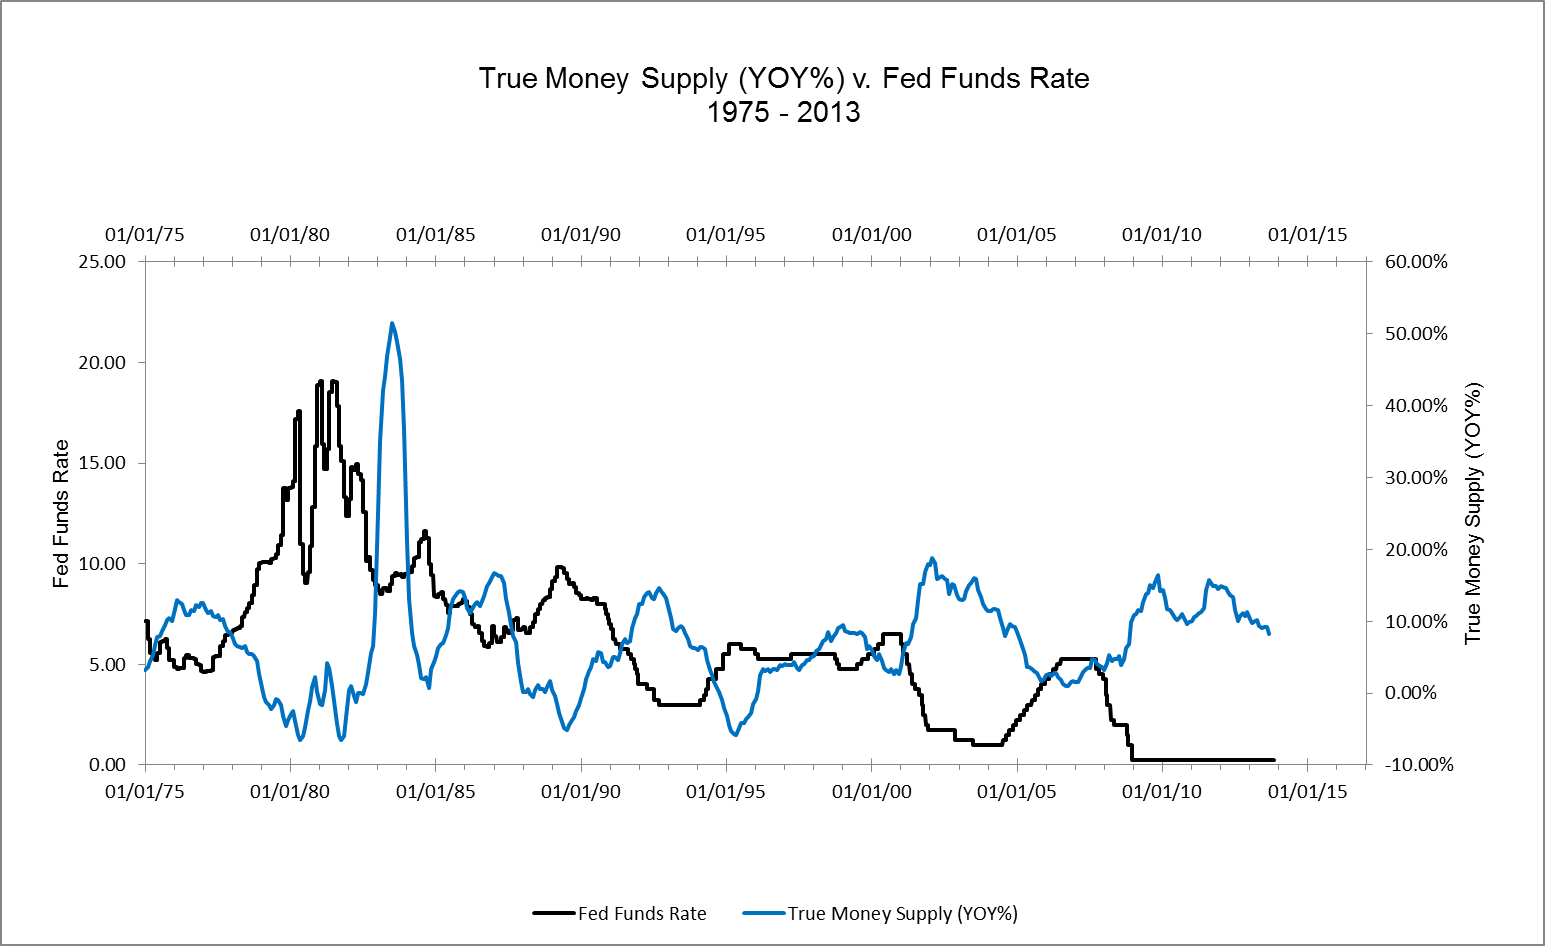
Figure 2 supports the assertion that a decrease in the Fed Funds Rate results in an increase in the growth rate of the True Money Supply, while an increase in the Fed Funds Rate results in a decrease in the growth rate — and sometimes an outright decrease — of the True Money Supply. The concept of the True Money Supply (TMS) was first articulated by Murray Rothbard and represents the amount of money in the economy that is available for immediate use in exchange. It has been referred to in the past as the Austrian Money Supply, the Rothbard Money Supply and the True Money Supply.
The benefits of TMS over conventional measures calculated by the Federal Reserve are that it counts only immediately available money for exchange and does not double count. Money Market Mutual Fund shares are excluded from TMS precisely because they represent equity shares in a portfolio of highly liquid, short-term investments which must be sold in exchange for money before such shares can be redeemed. For a detailed description and explanation of the TMS aggregate, see The “True” Money Supply: A Measure of the Supply of the Medium of Exchange in the U.S. Economy by Joseph T. Salerno (Austrian Economic Newsletter (Spring 1987)) and The Mystery of the Money Supply Definition by Frank Shostak (The Quarterly Journal of Austrian Economics Vol. 3, No. 4 (Winter 2000): 69-76). The True Money Supply data used to create the following graphs were provided courtesy of J. Michael Pollaro, author of The Contrarian Take.
Figure 2: True Money Supply (YOY%) v. Fed Funds Rate 1975 – 2013
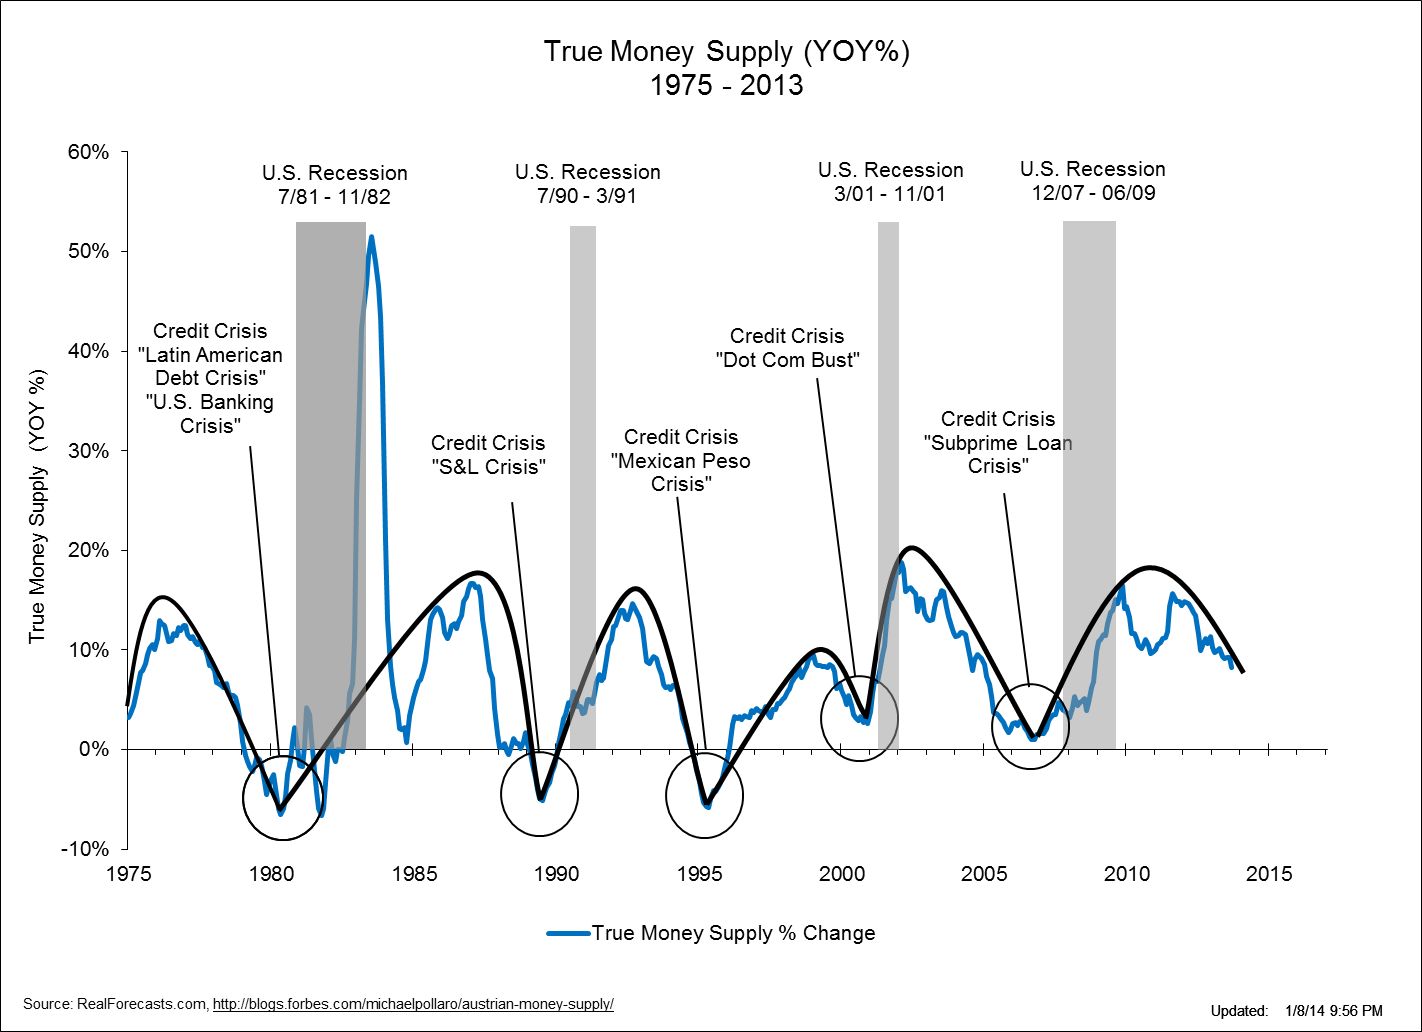
Given the strong inverse correlation between the Fed Funds Rate and the rate of growth of the True Money Supply, it’s not surprising that the five credit crises and four recessions that have occurred in the U.S. economy since 1975 were preceded by a period of sharp increase in the rate of growth of the True Money Supply followed by a period of sharp decrease in its growth rate. Again, a boom period followed by a bust. In each case, the credit crisis and recessions occurred shortly after the rate of growth of the True Money Supply became negative or began to approach zero. See Figure 3.
Figure 3: True Money Supply (YOY%) 1975 – 2013
It’s important to note that until the most recent credit crisis and recession, the Fed was able to implement a loose policy stance by simply lowering the Fed Funds Rate. In the Fall of 2008, however, the Fed Funds Rate began to approach 0%. To continue to force down interest rates and increase the growth of the money supply, the Fed began to provide loans to key sources of credit and purchase Treasury securities, GSE debt and mortgage-backed securities through its open market operations. This policy tool is commonly referred to as “quantitative easing” or QE for short. See Figure 4.
Figure 4: Fed Funds Rate and Federal Reserve Balance Sheet 2007 – 2013
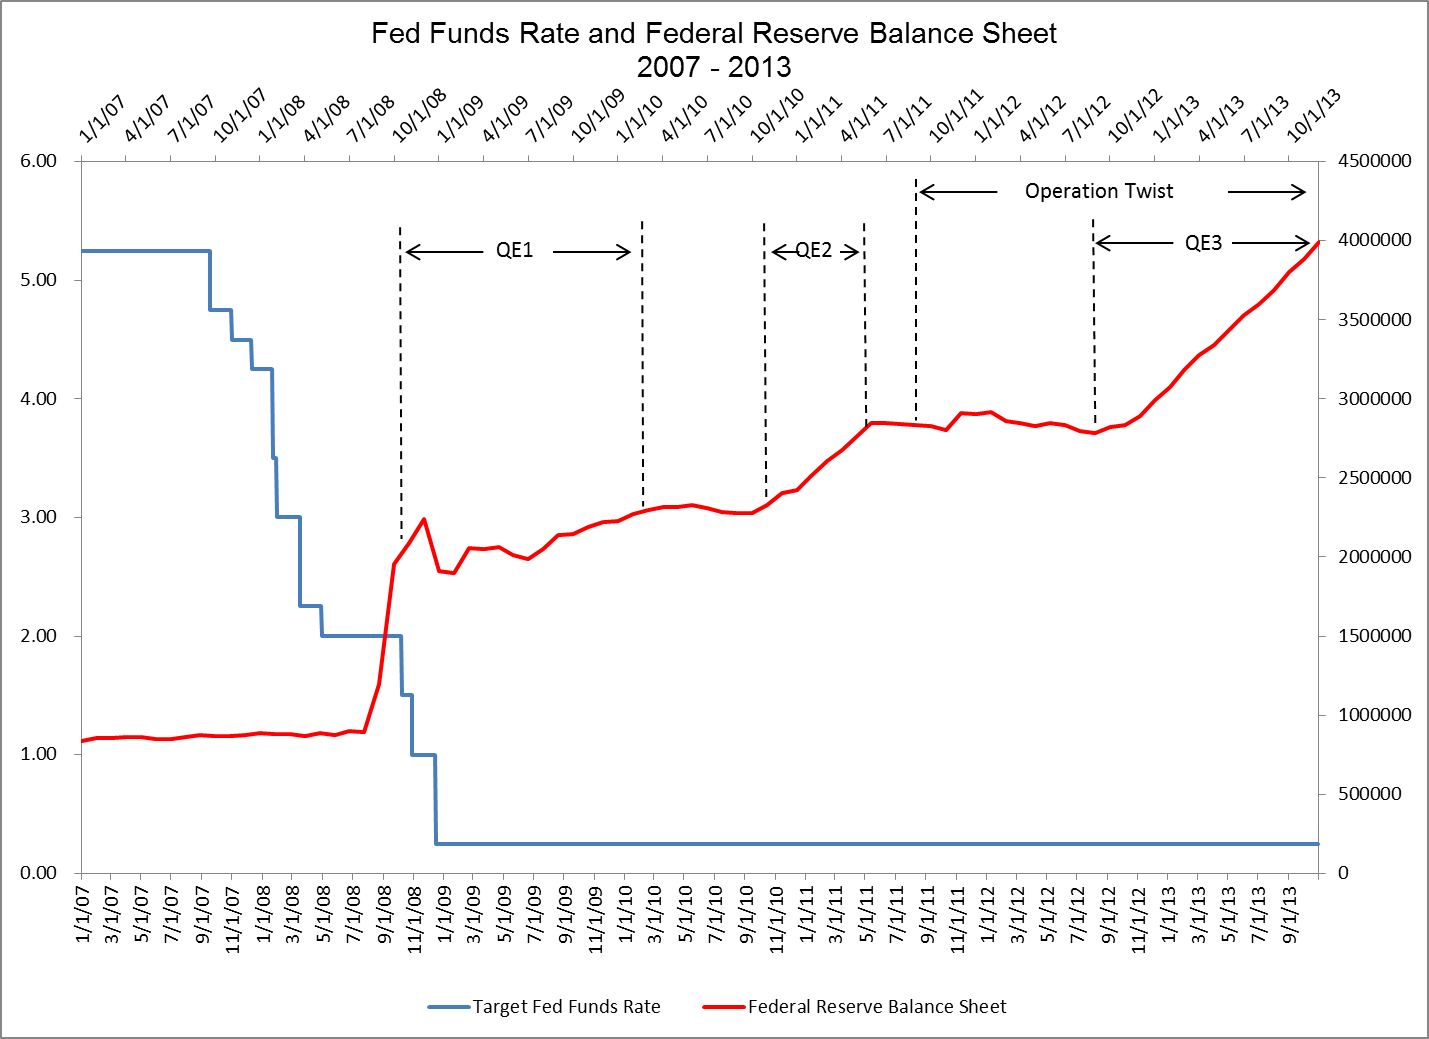 The Fed’s two most recent policy tools, Operation Twist and QE3, were specifically designed to force down long-term interest rates through the purchase of $45 billion of longer-term Treasury securities and $40 billion of agency mortgage-backed securities each month. On December 18, 2013, the FOMC announced that it would reduce its bond purchases under Operation Twist and QE3 from $85 million per month to $75 million per month, beginning in January of 2014. Going forward, the FOMC will add to its holdings of longer-term Treasury securities at a pace of $40 billion per month rather than $45 billion per month and will add to its holdings of agency mortgage-backed securities at a pace of $35 billion per month rather than $40 billion per month. Although the True Money Supply has been increasing during Operation Twist and QE3, it has been doing so at a decreasing rate. Again, see Figure 3. The Fed’s reduction in bond purchases will likely cause the growth of the True Money Supply to continue to decelerate and could set the stage for the next credit crisis.


Enjoy your articles.
Pingback: Is There Really A Corporate Debt Bubble That’s Ready To Burst? | RealForecasts.com
Pingback: Has The Growth Rate Of The True Money Supply Reached Its Nadir For This Cycle? | RealForecasts.com