
By Jeffrey J. Peshut
November 11, 2014
On Wednesday October 29th, the Federal Open Market Committee (FOMC) directed the Open Market Trading Desk at the Federal Reserve Bank of New York to conclude its asset purchase program — commonly referred to as Quantitative Easing or QE for short — by the end of October. The FOMC also directed the Open Market Trading Desk to maintain the existing policy of reinvesting principal payments from the Federal Reserve’s holdings of both agency debt and agency MBS into agency MBS and of rolling over maturing Treasury securities at auction. Now that QE has ended, RealForecasts.com will look back to see the impact it has had on the growth and growth rate of the True Money Supply (TMS) and then provide a forecast of the TMS growth rate between now and the end of 2016.
The Impact of Quantitative Easing on the Growth Rate of the True Money Supply
Since it began in November of 2008, the Fed’s QE policy has had a dramatic impact on the growth of the TMS. TMS grew from approximately $5.6 trillion in November of 2008 to almost $10.5 trillion at the end of September of this year — an increase of over $800 billion per year. (See Figure 1.)
Figure 1: True Money Supply ($ Billions) 1/1/05 – 9/1/14 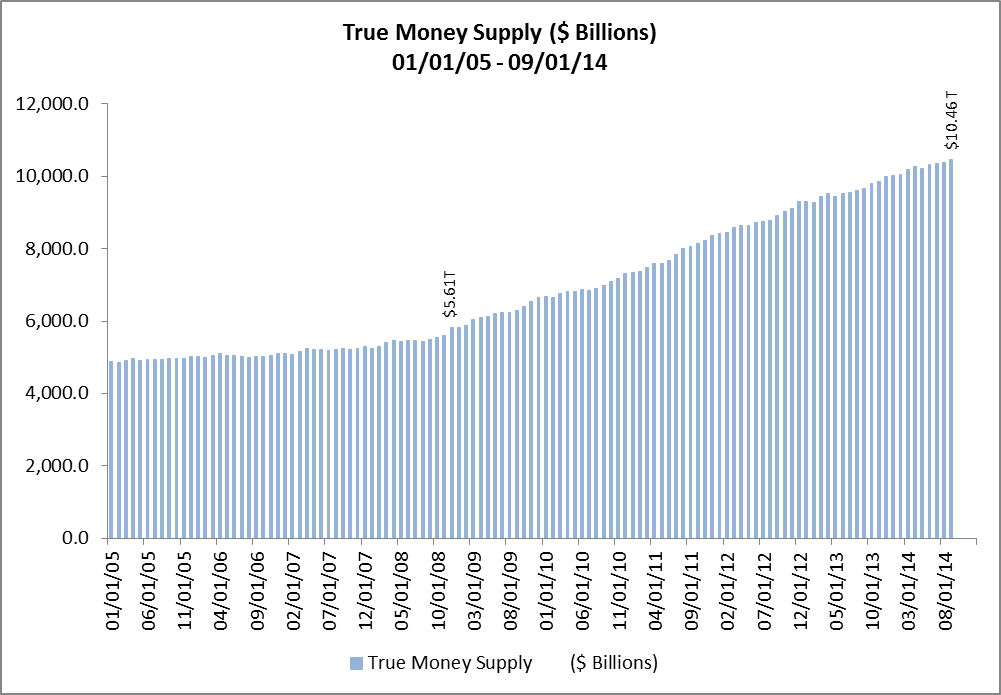 This represents an increase in TMS of 87.5% over 70 months or an average increase of 15% per year.
The growth of TMS accelerated sharply from November of 2008 to November of 2009 and from November of 2010 to August of 2011. These two periods correspond to the periods of QE1 and QE2, respectively. Between September of 2011 and December of 2013 — the period of QE3 — TMS growth decelerated, but then grew at a relatively constant rate of approximately 8% YOY during the Fed’s QE3 “Taper” policy that began in January of this year and just ended in October. (See Figure 2.)
Figure 2: True Money Supply (YOY%) 01/01/05 – 09/01/14 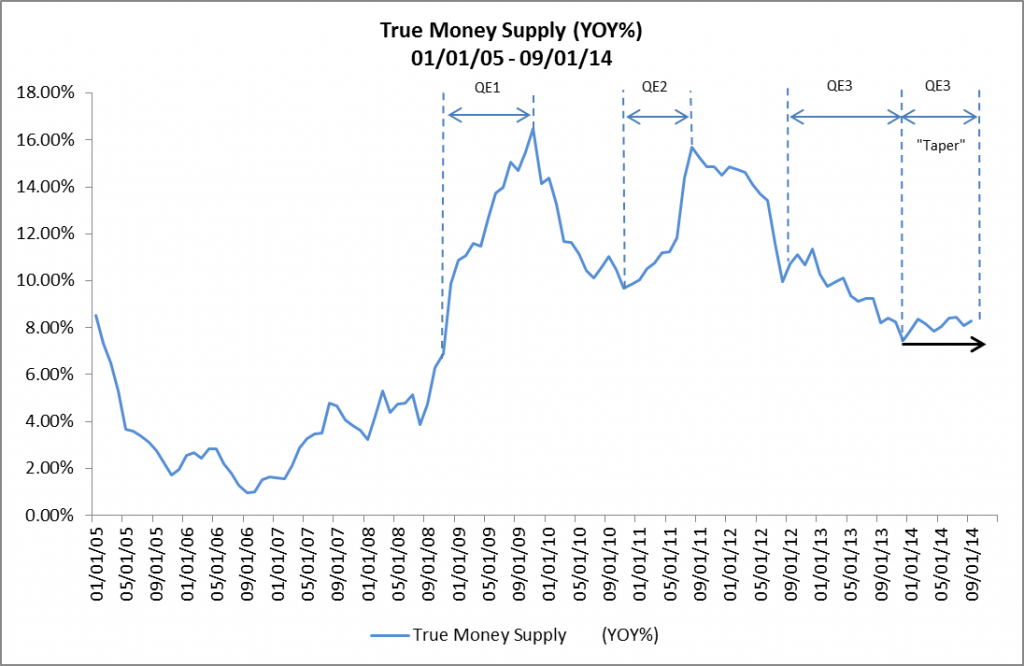
True Money Supply Forecast
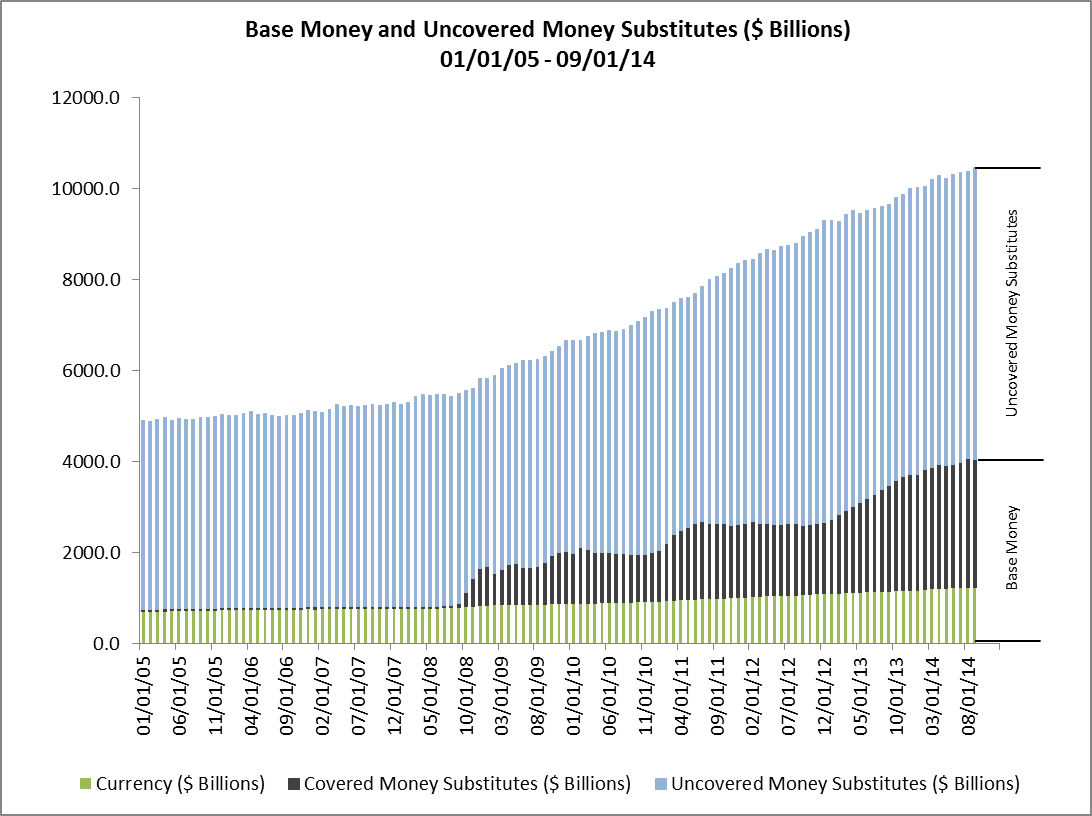
To forecast the growth rate of TMS in a post-QE economy, we need to first separate TMS into its two component parts — Base Money and Uncovered Money Substitutes. As explained in Is True Money Supply (TMS) Growth Continuing To Decelerate?, Base Money is made up of Currency Outstanding and Reserve Deposits held by the Fed — also known as Covered Money Substitutes. The rate of growth of Base Money is directly related to the level of bond-buying activity by the Fed. The Uncovered Money Substitute portion of TMS is money created by the “pyramiding” of Reserve Deposits through fractional reserve banking. The rate of growth of Uncovered Money Substitutes is directly related to the level of lending by the commercial banks.
Base Money (Currency and Covered Money Substitutes) and Uncovered Money Substitutes from January of 2005 through September of 2014 are shown in Figure 3. The impact of the Fed’s bond-buying activity on the growth of Base Money is clearly visible in the growth of Covered Money Substitutes beginning in November of 2008.
Figure 3: Base Money and Uncovered Money Substitutes ($ Billions) 01/01/05 – 09-01-14
During the almost six-years of Quantitative Easing, three periods of accelerating growth of Base Money stand out — from November of 2008 to September of 2009, from November of 2010 to August of 2011 and from September 2012 to November of 2013. (See Figure 4.) The first period corresponds to most of QE1, while the second and third periods correspond directly to the periods of QE2 and QE3, respectively.
Figure 4: Base Money (YOY%) 01/01/05 – 09-01-14 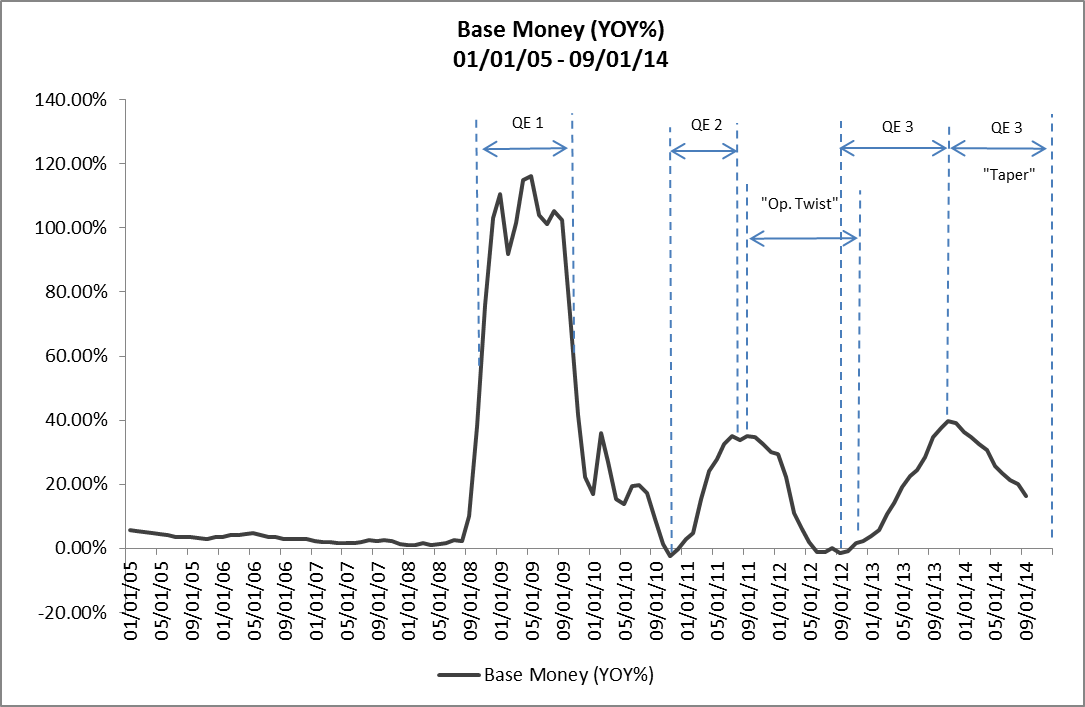
Under a fractional reserve banking system, we’d expect that an increase in Base Money caused by an increase in Covered Money Substitutes — or Reserve Deposits — under QE would generate an increase in lending activity by commercial banks — which in turn would generate an increase in Uncovered Money Substitutes. That is exactly what happened under QE1 and QE2, and has begun to happen under QE3. (See Figure 5.)
Figure 5: Base Money and Uncovered Money Substitutes (YOY%) 01/01/10 – 09-01-14 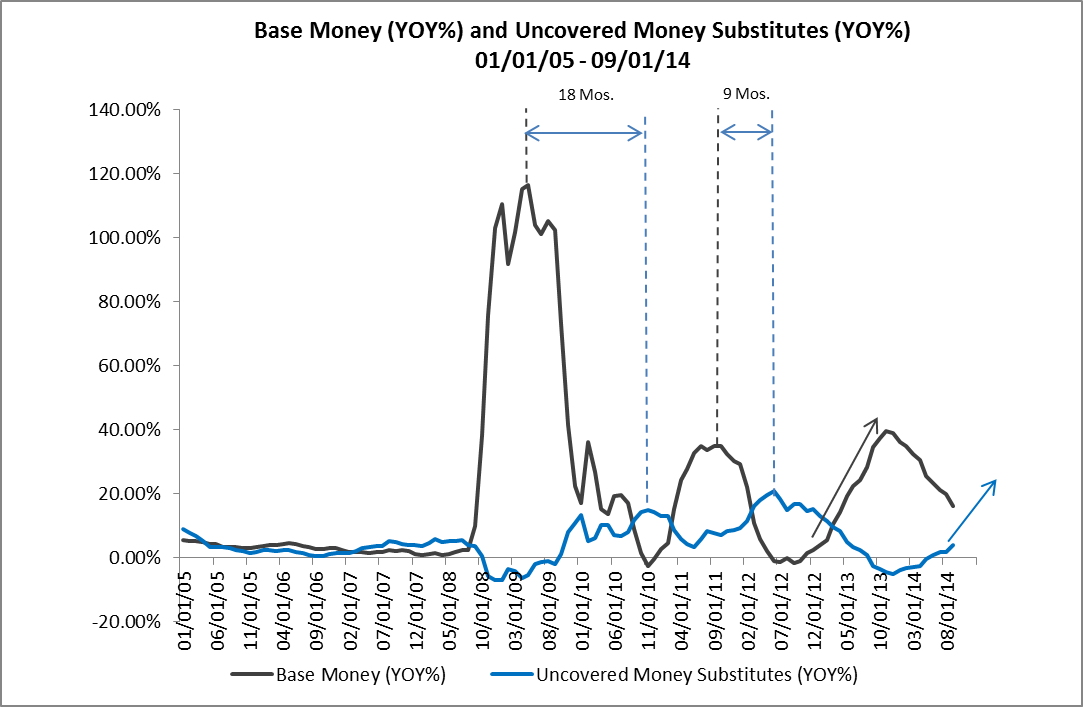
Notice that the peak in the growth rate of Uncovered Money Substitutes lagged the peak in the growth rate of Base Money by 18 months after QE1 and by 9 months after QE2. The last peak in the rate of growth of Base Money occurred 12 months ago, in November of 2013. If we assume that the growth rate of Uncovered Money Substitutes lags the peak in the growth rate of Base Money by 18 months — the longer and more conservative of the periods after QE1 and QE2 — then the growth rate of Uncovered Money Substitutes should peak in mid-2015. (See Figure 6.)
Figure 6: Base Money and Uncovered Money Substitutes (YOY%) 01/01/10 – 09-01-14 Actual and 10/1/14 – 12/31/16 Forecast 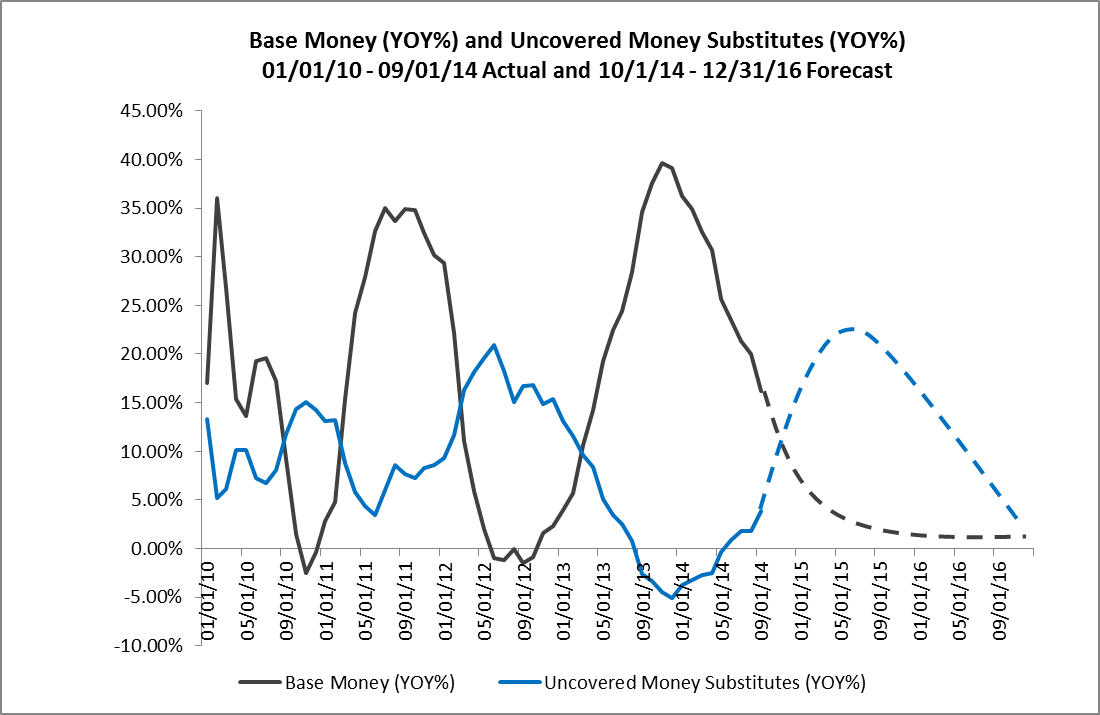
During the first nine months of 2014, the acceleration of lending activity by commercial banks has more than offset the deceleration of the Fed’s bond-buying activity under the QE3 Taper, which explains why the growth rate of TMS during 2014 has held constant at about 8% in the face of the Base Money’s decelerating growth. Once the rate of growth of Uncovered Money Substitutes peaks, however, the TMS growth rate will once again decelerate, approaching 0% by the end of 2016. (See Figure 7.)
Figure 7: True Money Supply (YOY%) 01/01/10 – 09-01-14 Actual and 10/01/14 – 12/31/16 Forecast 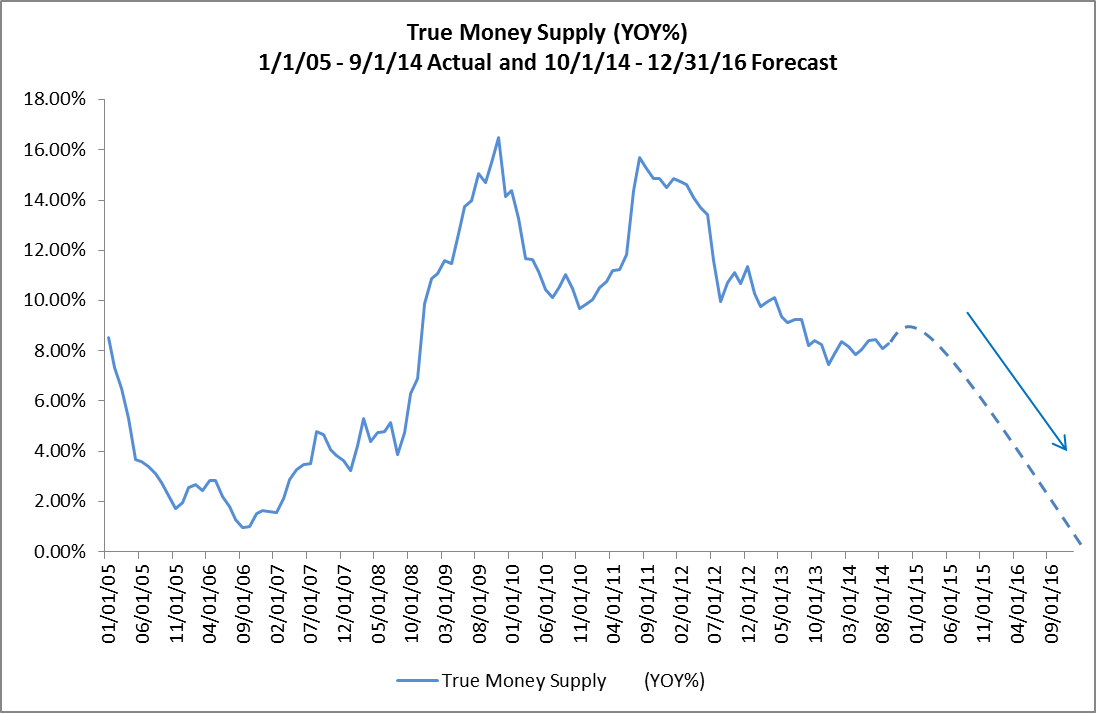
So, for now, it looks like the TMS growth rate will remain constant or may even accelerate slightly through mid-year 2015, at which point it will turn downward and continue downward through the end of 2016. Of course, this forecast is predicated on the Fed continuing its current policy stance. In the event the Fed changes its stance, all bets are off and it will be necessary to adjust this forecast in light of the changed policy. Continue to check back with RealForecasts.com for future updates about changes in the TMS growth rate.
As always, thanks to J. Michael Pollaro, author of The Contrarian Take, for the TMS data used to construct the charts in this article. To see more of Michael’s TMS data, go to http://blogs.forbes.com/michaelpollaro/austrian-money-supply/.


Pingback: After QE, Whence the Economy? | The Liberty Herald
Pingback: After QE, Whither the Economy? - Investing Video & Audio Jay Taylor Media
Pingback: Wall Street National | The U.S. Money Supply Decelerates in October, the Risk of an Economic Bust Just Went Up - Wall Street National
Pingback: Can Real Estate Investors Manage Through The Boom/Bust Cycle? | RealForecasts.com
Pingback: What Does The Dramatic Deceleration In The Growth Of The True Money Supply Mean For Real Estate Investors? | RealForecasts.com