Is There Really A Corporate Debt Bubble That’s Ready To Burst?
By Jeffrey J. Peshut
December 3, 2018
Over the past several months, media headlines have been awash with dire warnings of a looming corporate debt bubble that is about to burst. Some of the more provocative headlines include:
- The corporate bond bubble is starting to burst (Business Insider, May 26, 2018)
- Beware the “mother” of all credit bubbles (Washington Post, June 8, 2018)
- Are corporate bonds a bubble ready to burst? (Financial Times, July 27, 2018)
- The big dangerous bubble in corporate debt (New York Times, August 9, 2018)
- How Dangerous Is the Corporate Debt Bubble? (Knowledge@Wharton, August 20, 2018)
- The U.S. is experiencing a dangerous corporate debt bubble (Forbes, August 29, 2018)
- Ten years after financial crisis: Is corporate debt the next bubble? (USA Today, September 14, 2018)
- How The Corporate Debt Bubble Will Destroy The Economy (ValueWalk, September 26, 2018)
- A $9 trillion corporate debt bomb is ‘bubbling’ in the US economy (CNBC, November 21, 2018)
- When Blue Chip Companies Pile On Debt, It’s Time To Worry. (New York Times, November 26, 2018)
From the perspective of Austrian Business Cycle Theory. this post will explore the questions of whether there really is a corporate debt bubble — and, if there is, when we can expect it to burst. But first, let’s define corporate debt.
Corporate Debt
According to Federal Reserve Statistical Release Z.1, Financial Accounts of the United States, the non-financial “corporate business debt” sector consists of all private for-profit domestic non-financial corporations. S Corporations, which have 35 or fewer stockholders and are taxed as if they were partnerships, are included in this sector. Corporate farms are also included. Holding companies and equity real estate investment trusts (REITs), which are considered financial businesses, are excluded from this sector.
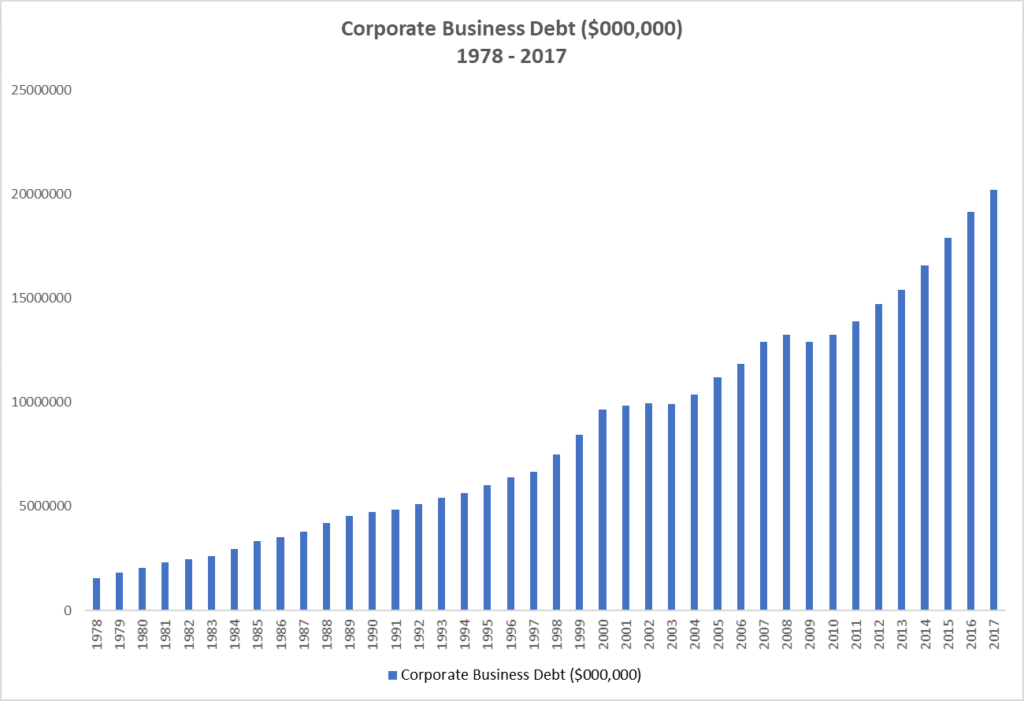
Corporate Business Debt outstanding totaled $20.2 trillion at the end of 2017, an increase of $7.3 trillion from the cyclical low of $12.9 trillion at the end of 2009. (See Figure 1.) This reflects a 56.6% increase over that eight-year period.
Figure 1: Corporate Business Debt ($000,000) 1978 – 2017
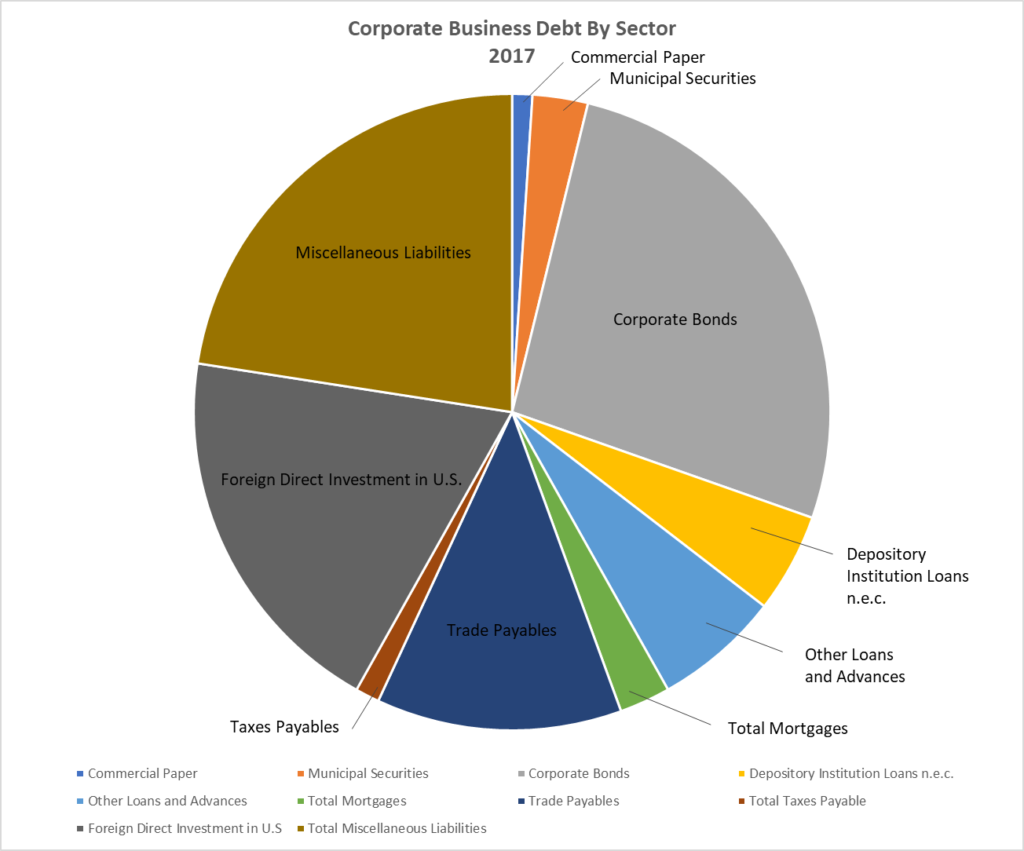
The $20.2 trillion of outstanding Corporate Business Debt includes debt securities that include Corporate Bonds ($5.4 trillion), Municipal Securities ($568 billion) and Commercial Paper ($207 billion), Foreign Direct Investment in U.S. ($3.9 trillion), loans that include Depository Institution Loans ($1.0 trillion), Other Loans and Advances ($1.3 trillion) and Total Mortgages ($522 trillion), Trade Payables ($2.5 trillion) and Miscellaneous Liabilities ($4.6 trillion). (See Figure 2.)
Figure 2: Corporate Business Debt By Sector 2017
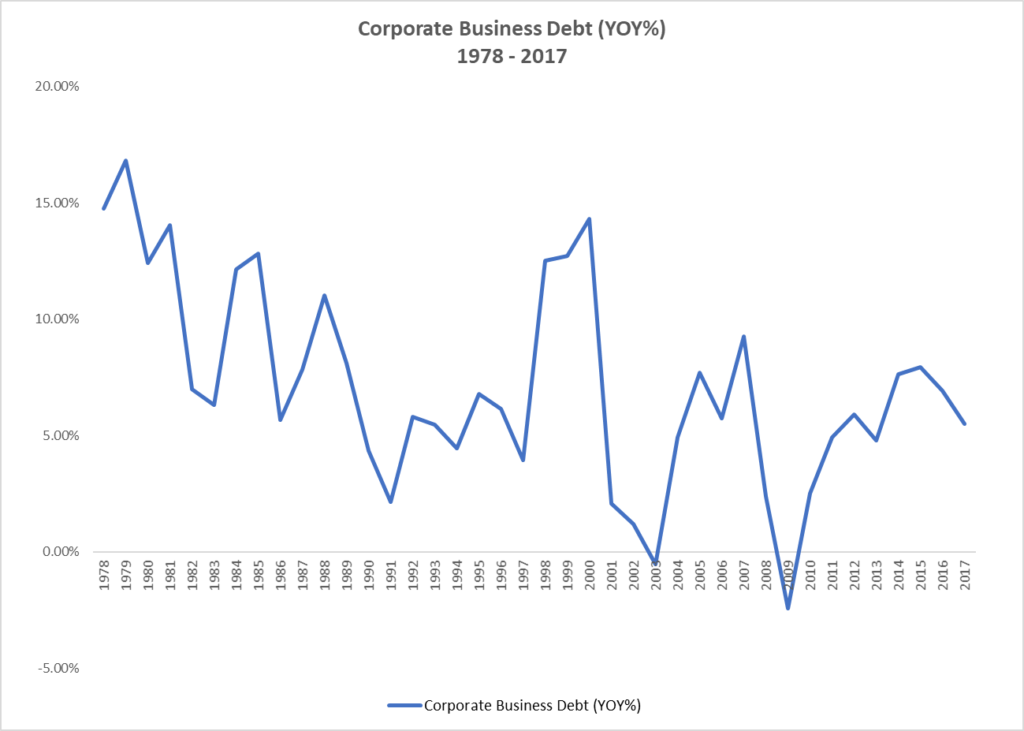
The year-over-year percentage growth of Corporate Business Debt from 1978 through 2017 is presented in Figure 3. This chart vividly illustrates the cycles in Corporate Business Debt over the past 40 years. Note the cyclical peaks in its growth rate of 12.8% in 1984, 14.3% in 2000, 9.26% in 2007 and what will likely be the peak for the current cycle of 7.95% in 2015 and the cyclical troughs in its growth rate of 6.33% in 1982, 2.12% in 1991, -.56% in 2003 and -2.43% in 2009. The cyclical trough for the current cycle has yet to be revealed.
Figure 3: Corporate Business Debt (YOY%) 1978 – 2017
Non-Corporate Debt
The non-financial “non-corporate business debt” sector consists of partnerships and limited liability companies (businesses that file IRS Form 1065), sole proprietorships (businesses that file IRS Schedule C) and individuals who receive rental income (income debt reported on IRS Schedule E). Non-corporate farms are included in this sector. Investment properties owned by individuals and the corresponding mortgages are also included in this sector.
Companies in this sector are not necessarily small, but they generally do not have access to the debt securities markets like companies in the corporate business debt sector and thus rely on loans from commercial banks, trade credit and other credit providers for funding.
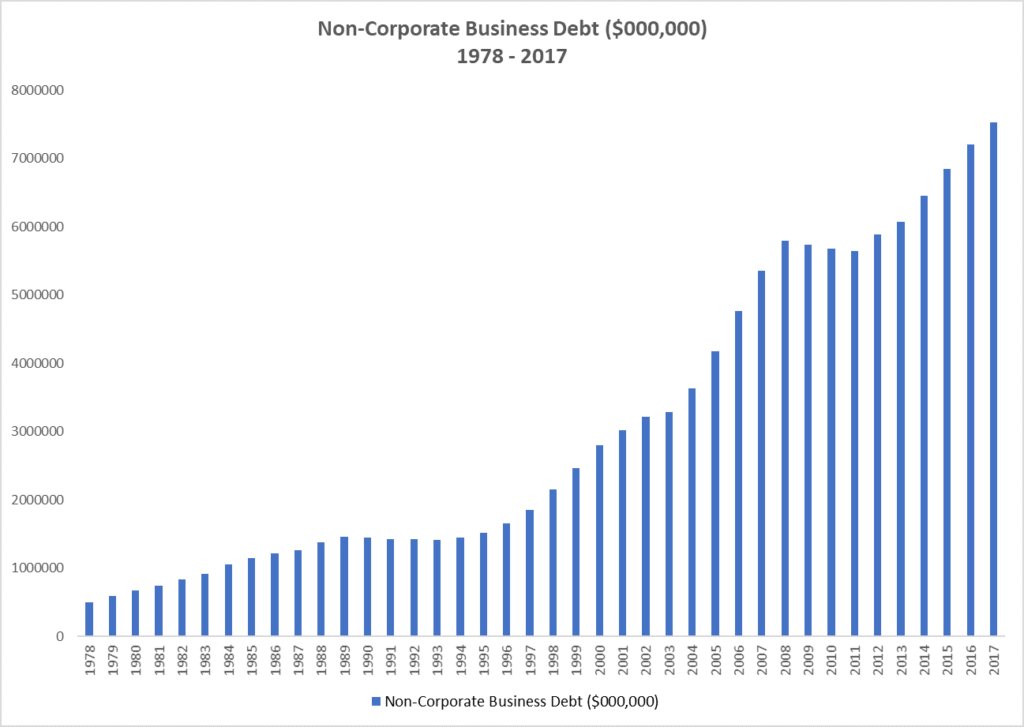
Non-Corporate Business Debt outstanding totaled $7.5 trillion at the end of 2017, an increase of $1.9 trillion from the cyclical low of $5.6 trillion at the end of 2011. (See Figure 4.) This reflects a 33.5% increase over that six-year period.
Figure 4: Non-Corporate Business Debt ($000,000) 1978 – 2017
The $7.5 trillion of outstanding Non-Corporate Business Debt includes Total Mortgages ($3.8 trillion), loans that include Depository Institution Loans ($1.3 trillion), Other Loans and Advances ($206 billion), Trade Payables ($672 billion) and Unidentified Miscellaneous Liabilities ($1.4 trillion). (See Figure 5.)
Figure 5: Non-Corporate Business Debt By Sector 2017
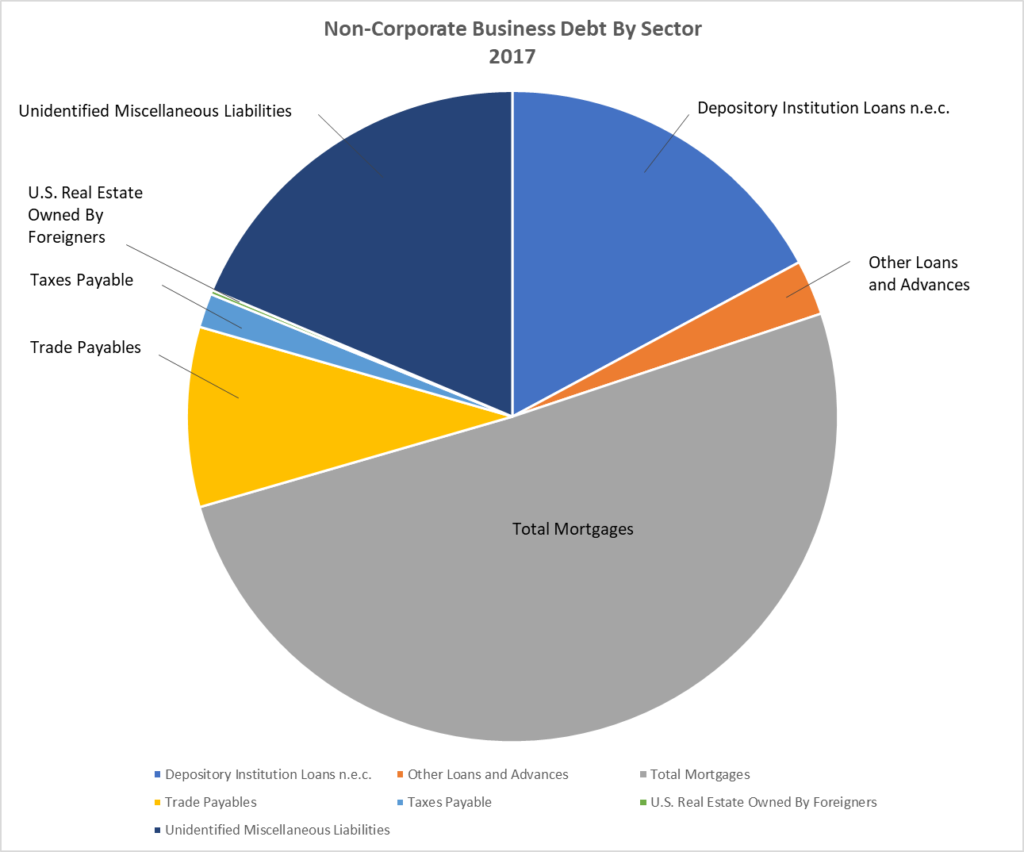
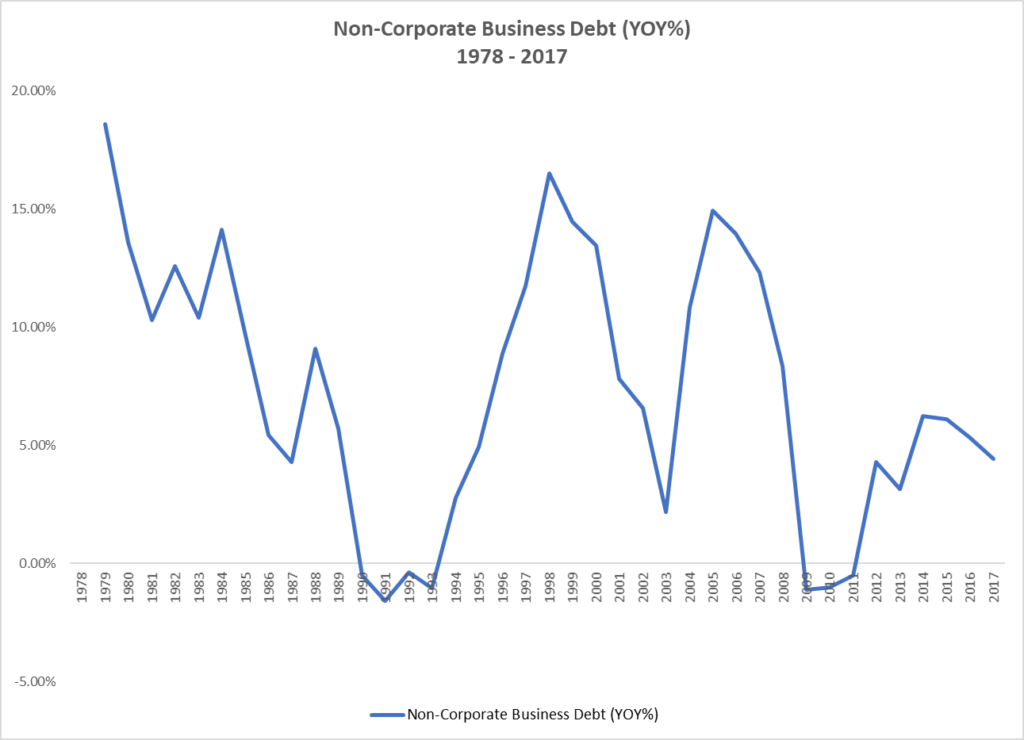
Figure 6 presents the year-over-year percentage growth of Non-Corporate Business Debt from 1978 through 2017. Similar to Figure 3, Figure 6 clearly shows the cycles in Non-Corporate Business Debt over the past 40 years. Note the cyclical peaks in its growth rate of 14.12% in 1984, 16.50% in 1998, 14.93% in 2005 and what will likely be the peak for the current cycle of 6.22% in 2014 and the cyclical troughs in its growth rate of 4.30% in 1987, -1.58% in 1991, 2.18% in 2003 and -1.11% in 2009. Again, the cyclical trough for the current cycle has yet to be revealed.
Figure 6: Non-Corporate Business Debt (YOY%) 1978 – 2017
Combined, the $20.2 trillion of “corporate business debt” and the $7.5 trillion of “non-corporate business debt” make up the total business debt of $27.7 trillion.
True Money Supply
Followers of the Austrian School of economic thought and regular readers of RealForecasts.com understand that changes in monetary policy by the Federal Reserve System’s Federal Open Market Committee (FOMC) and the resulting rate of change of U.S. Base Money, Commercial and Consumer Lending and the Money Supply can be used as leading indicators to accurately forecast changes in the economy, financial markets and real estate markets. (See, Does The Federal Reserve Really Create The Boom/Bust Cycle?) Therefore, to determine whether there is a corporate debt bubble that’s ready to burst, it’s helpful to look to changes in the rate of growth of the Austrian measure of the money supply, also known as the True Money Supply or TMS.
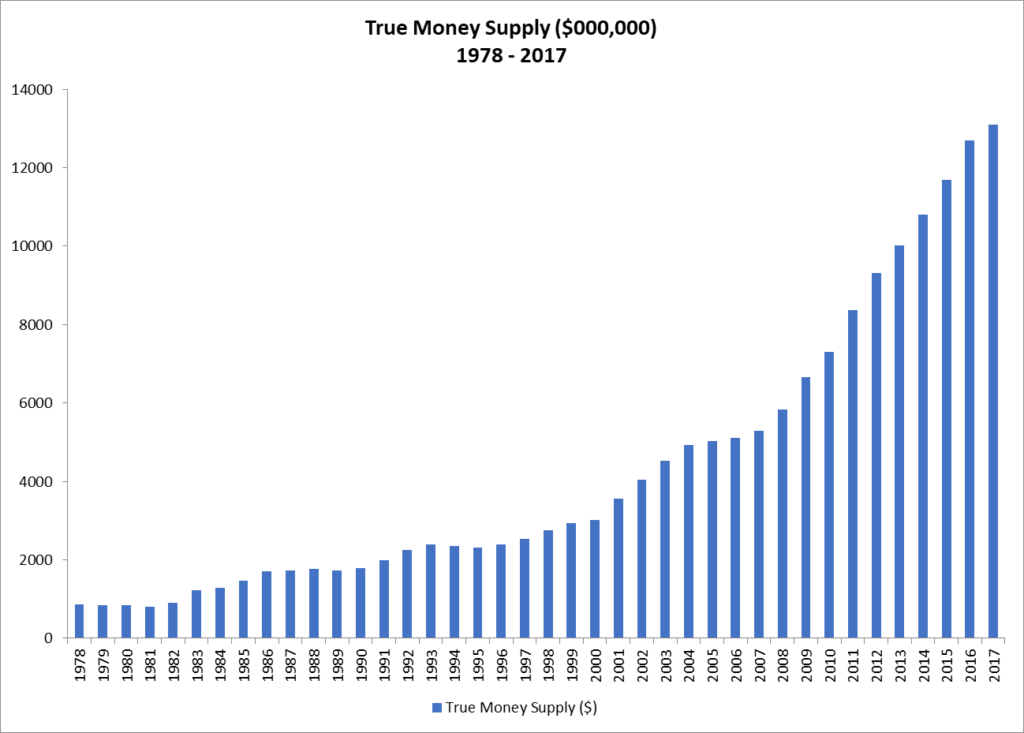
At the end of 2017, the True Money Supply totaled $13.1 trillion, an increase of $8.0 trillion from the cyclical low of $5.1 trillion at the end of 2006. (See Figure 7.) This reflects an astounding 156.9% increase over that 11-year period. To put that into perspective, TMS increased from the cyclical low of $3.0 trillion in 2000 to $5.1 trillion in 2006, an increase of “only” $2.1 trillion or 70% during the height of the most recent housing bubble. Is it any wonder that we’ve seen such exponential increases in asset values since the institution of Quantitative Easing?
Figure 7: True Money Supply ($000,000) 1978 – 2017
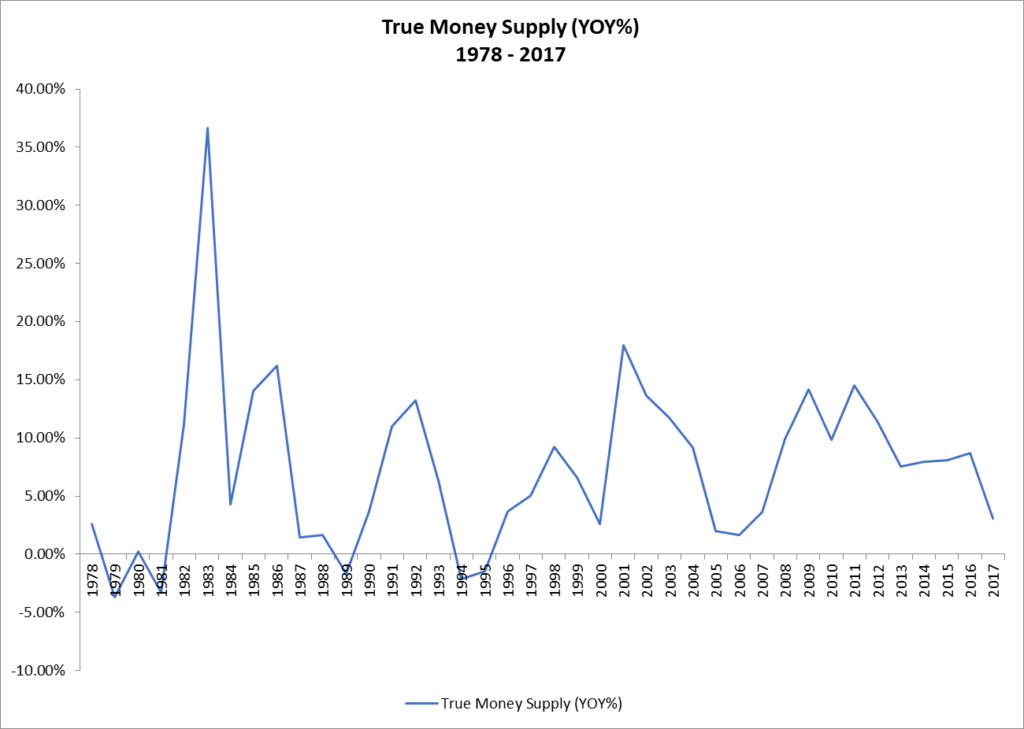
The year-over-year percentage growth of TMS is shown in Figure 8. Note the cyclical peaks in the TMS growth rate of 36.66% in 1983, 13.27% in 1992, 18.00% in 2001, and what will likely be the peak for the current cycle of 14.49% in 2011. Also note the cyclical troughs in the TMS growth rate of -1.63% in 1989, -2.11 in 1994, 2.61% in 2000 and 1.66% in 2006. Based upon the precipitous drop in the TMS growth rate over the past year and the Fed’s current monetary stance, the next cyclical trough in the TMS growth rate is likely not too far off.
Figure 8: True Money Supply (YOY%) 1978 – 2017
Corporate Debt vs. True Money Supply
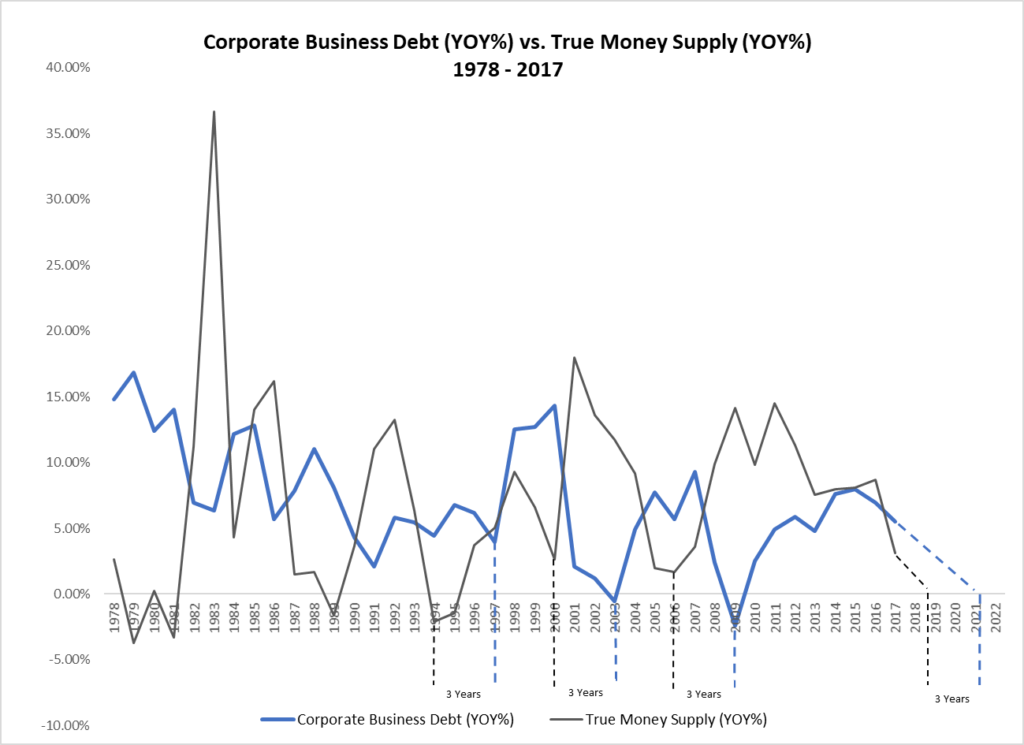
The relationship between changes in the growth rate of Corporate Business Debt and the True Money Supply is set forth in Figure 9. Generally, the trough in the growth rate of Corporate Business Debt lags the trough in TMS by about three years. If this relationship holds true for the current cycle, the growth rate for Corporate Business Debt should reach its next trough in the 2021 to 2022 time-frame.
Figure 9: Corporate Business Debt (YOY%) vs. True Money Supply (YOY%) 1978 – 2017
Conclusion
Although the analysis presented in this post indicates that the growth rate of Corporate Business Debt reached its cyclical peak in 2015 and that the growth rate of TMS is nearing its cyclical trough, the three-year lag between the growth rate of Corporate Business Debt and the growth rate of TMS suggest that the growth rate of Corporate Business Debt won’t reach its next cyclical trough until the 2021 to 2022 time-frame. Therefore, warnings that a corporate debt bubble is ready to burst seem premature.