What Does The Dramatic Deceleration In The Growth Of The True Money Supply Mean For Real Estate Investors?
By Jeffrey J. Peshut
February 21, 2018
On February 5, 2018, Jerome Powell was sworn in as the 16th Chair of the Board of Governors of the Federal Reserve System. Powell succeeded Janet Yellen, who was sworn in as Fed Chair on February 3, 2014, a little more than a month after the Federal Reserve ended its asset purchase program commonly referred to as Quantitative Easing or “QE” for short.
In November of 2014, in response to the end of Quantitative Easing and Janet Yellen’s appointment as Fed Chair, RealForecasts.com published a post titled How Will The End Of Quantitative Easing Impact The True Money Supply Growth Rate? In that post, RealForecasts.com forecasted a deceleration in the growth of the True Money Supply (TMS) from about 9% year-over-year (YOY) at the beginning of 2015 to 0% YOY at the end of 2016.
This post will update the actual growth rate of TMS since the end of QE and explain what it means to real estate investors like those you can find on this site. It will also provide some possible strategies that real estate investors can adopt in response to changing economic and real estate market conditions. Some real estate investors may want to build upon their financial backing to make sure they are working with the market fluctuations. They may want to look at investing in Bitcoin by gaining some advice from people who have already gone into it and have checked out helpful articles such as – Bitcoin Superstar Erfahrungen to keep them steady with their investments and to see what the risks are.
True Money Supply Growth Rate Since The End of Quantitative Easing
As suggested above, the Federal Reserve ended Quantitative Easing in December of 2013. Two years later, in December of 2015, the Fed began raising the Fed Funds Target Rate — with an initial increase from .25% to .50%. This was the first time that the Fed had raised the Fed Funds Rate since June of 2006.
During this two-year period, TMS grew at a remarkably consistent rate of about 8% YOY. The steady growth of TMS continued during the first half of 2016 and even accelerated briefly to 11.15% YOY in October of 2016. (See Figure 1.)
Figure 1: True Money Supply (YOY%) 01/01/08 – 12/31/17
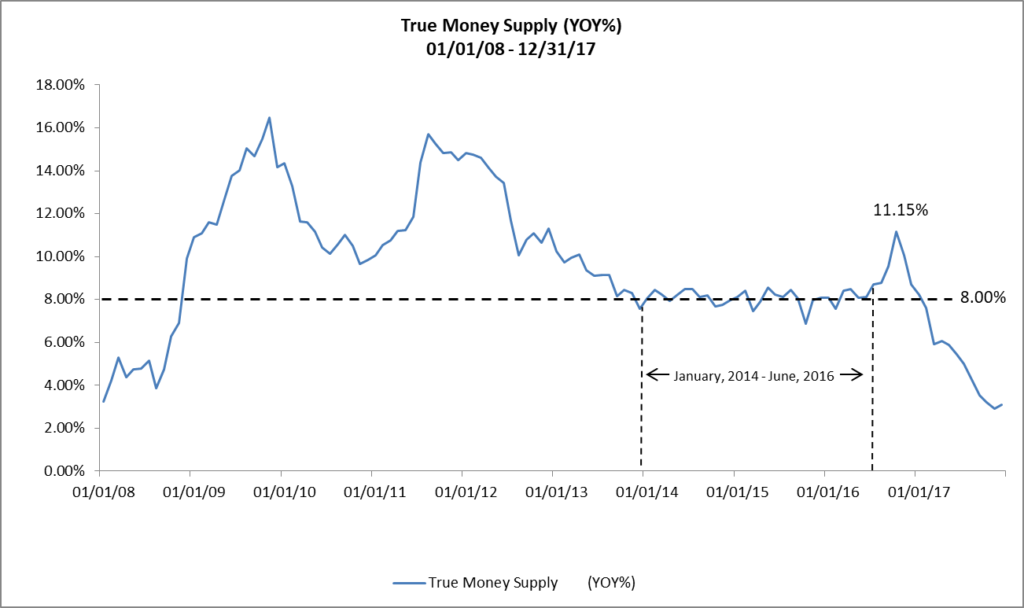
In December of 2016, and in March, June and December 2017, the Fed continued to increase the Fed Funds Rate in 25 bps increments to its current rate of 1.50%.
Moreover, on September 20, 2017, the Fed announced that it would begin to reduce the $4.5 trillion balance sheet that it had amassed during QE by selling $10 billion of assets each month from October through December of 2017, $20 billion per month from January through March of 2018, $30 billion per month from April through June of 2018, $40 billion per month from July through October 2018 and $50 billion per month from October through December of 2018 for total sales of $450 billion by the end of 2018. The Fed also announced plans to raise the Fed Funds Rate three more times during 2018 to end the year above 2 %.
In response to the Fed’s increasingly tighter monetary stance, the growth rate of TMS has decelerated dramatically, from 11.15% YOY in October of 2016 to 3.10% YOY in December of 2017.
This is the same magnitude of deceleration that RealForecasts.com had forecasted in November of 2014, but because the Fed unexpectedly delayed its decision to begin raising the Fed Funds Rate and reduce its balance sheet, it occurred about a year later than expected. Note that this is the most dramatic deceleration during a period of monetary tightening since TMS decelerated from 9.54% YOY in October of 2004 to 1.71% YOY in November of 2005. (See Figure 2.) In that case, after accelerating slightly from December of 2005 to April of 2006, the TMS growth rate decelerated to its cyclical low of ,98% YOY in September of 2006.
Figure 2: True Money Supply (YOY%) 01/01/03 – 12/31/17
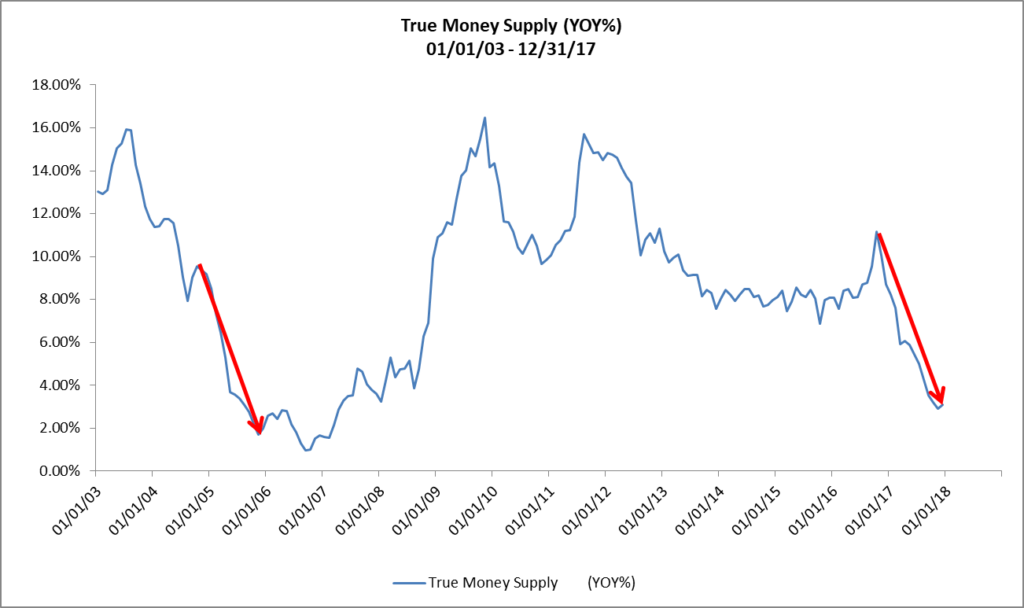
If the Fed sticks with its plans to continue to both raise the Fed Funds Rate and reduce its balance sheet during 2018, it’s easy to see that the growth of TMS could grind to a halt and even begin to contract later this year.
What Does This Mean For Real Estate Investors?
In previous posts such as Where Are The Employment Markets In Their Cycles? and Where Will Commercial Real Estate Returns Go From Here?, RealForecasts.com demonstrated that changes in the TMS growth rate can accurately forecast changes in the growth rate of Total Employment. Further, because of the the strong correlation between the YOY growth rate of Total Employment and the annual returns from private-market real estate equity investments, as reflected in the NCREIF Property Index (NPI), changes in Total Employment can help us to forecast changes in the NPI.
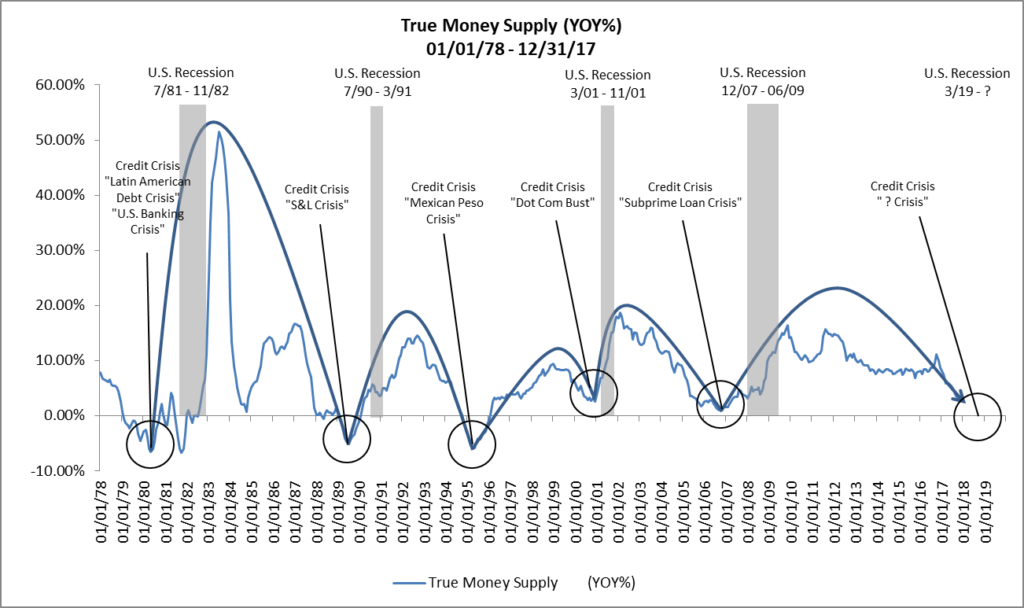
Figure 3 shows the acceleration and deceleration of the expansion — and sometimes contraction — of TMS dating back to 1978. Note that in each TMS expansion and contraction cycle, the Fed maintained a tight policy stance until a credit and liquidity crisis occurred. Also, an economic recession typically occurred shortly after the credit and liquidity crisis. Finally, of particular note is the length of the loose policy stance in the current cycle and, until recently, the slow pace of tightening since the end of QE.
Figure 3: True Money Supply (YOY%) 01/01/78 – 12/31/17
RealForecasts.com expects that the growth of TMS will continue its downward trend in the months ahead, as the Federal Open Market Committee continues to raise the Fed Funds Target Rate and reduce its balance sheet. Based upon the current trajectory of this trend, and the Fed’s current policy stance, it looks like the next credit and liquidity crisis could occur during the second half of 2018, with an economic recession and real estate market downturn to follow. Of course, this forecast could change if the Fed changes its policy stance or if the commercial banks change their pace of lending activity.
In the meantime, real estate investors would be wise to take advantage of the still robust capital markets environment to begin selling some of their under-performing and less-strategic assets and using the proceeds to reduce the leverage on their remaining properties and portfolios. Whether the current climate makes any attempt to buy luxury homes MacDonald highlands unpalatable remains to be seen. By “dealing from the bottom of the deck” and reducing leverage, they will be improving the risk profile of their portfolios in anticipation of – and not in reaction to – the next credit and liquidity crisis, economic recession and real estate market downturn.
Many thanks to Michael Pollaro at The Contrarian Take for providing the TMS data used in this post.