What Is So Good About Gold?
By Jeffrey J. Peshut
December 7, 2014
Warren Buffett — who is the second-wealthiest man in the U.S. with a net worth of $72.7 billion according to Forbes.com — once said this about gold:
Gold gets dug out of the ground in Africa, or someplace. Then we melt it down, dig another hole, bury it again and pay people to stand around guarding it. It has no utility. Anyone watching from Mars would be scratching their head.
If the country’s second-wealthiest man has such antipathy toward it, what is so good about gold? Before attempting to answer that question, let’s first take a look at what gold is and what it isn’t.
What Is Gold?
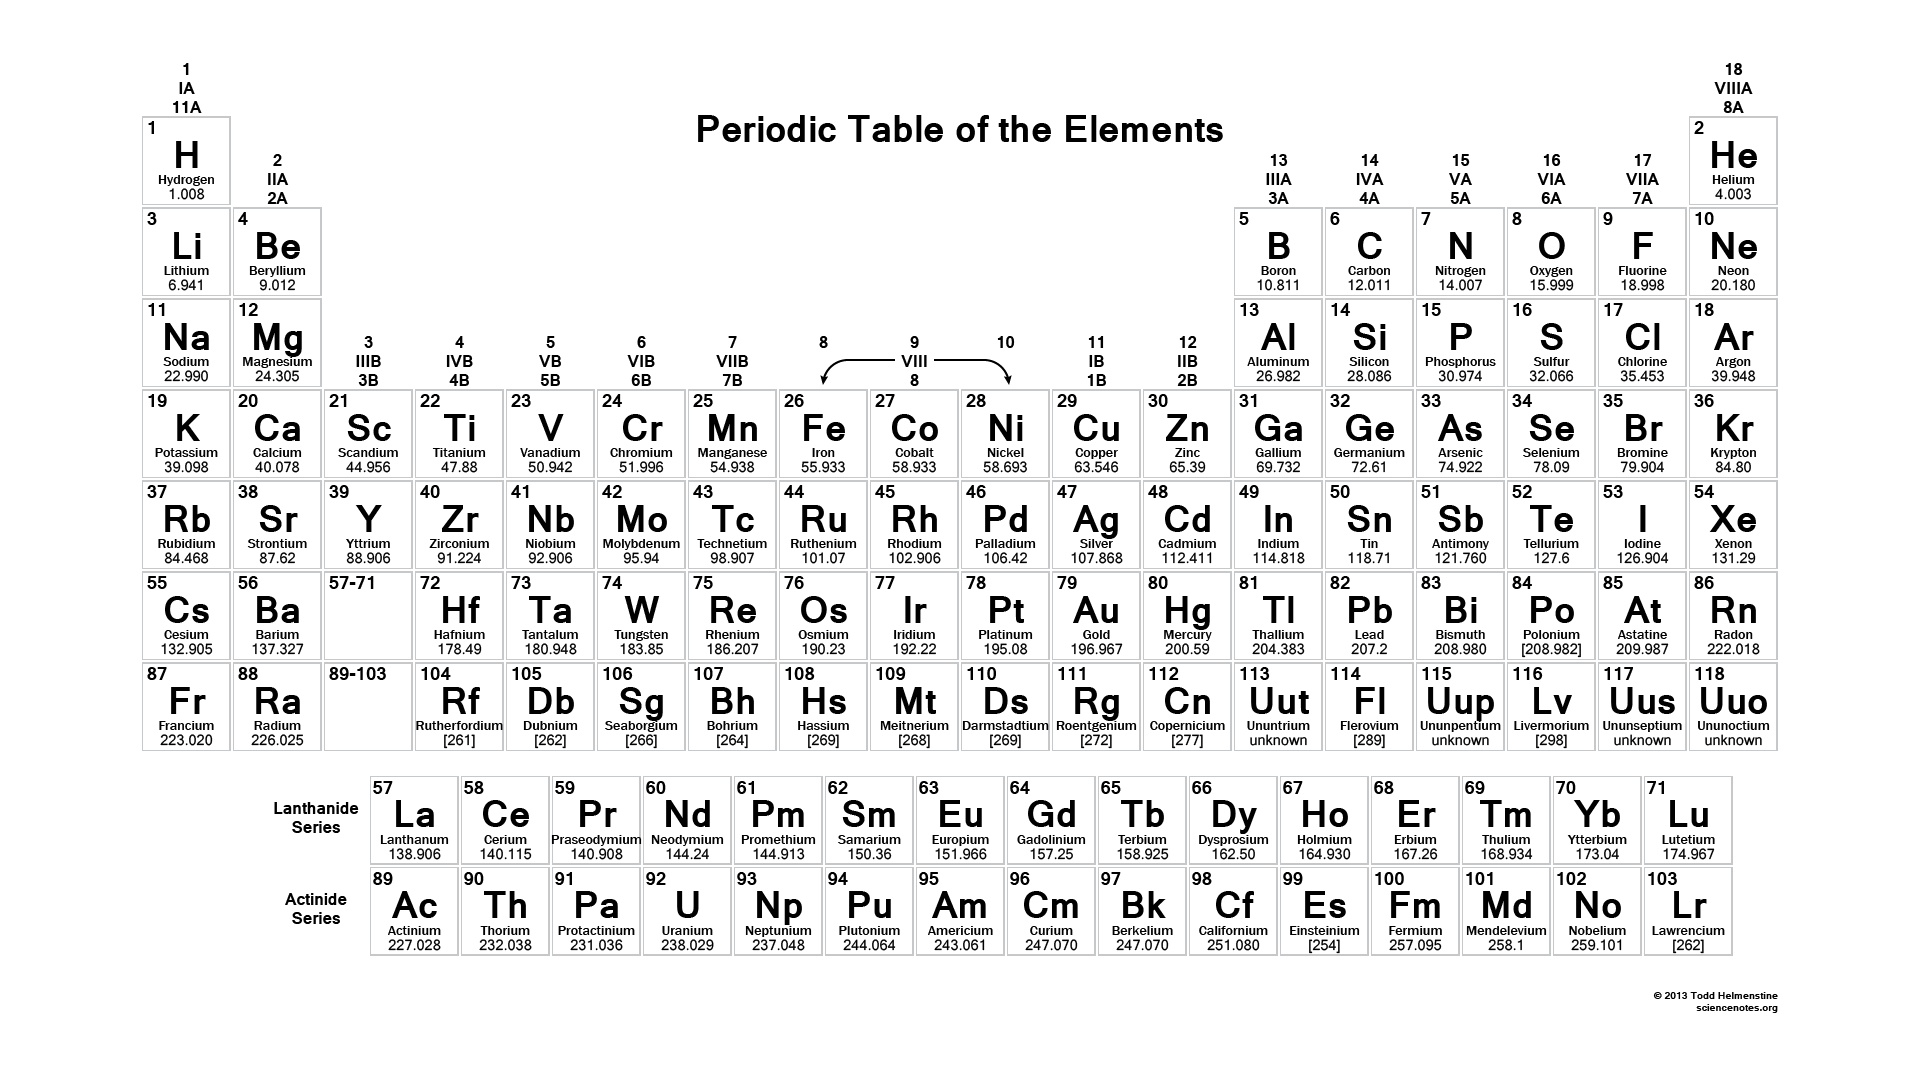
Despite Warren Buffett’s remark about head-scratching Martians, there is nothing mysterious about gold. Scientifically speaking, gold is a chemical element with the symbol Au and the atomic number of 79 — between platinum (Pt) and mercury (Hg) and directly below silver (Ag) on the Periodic Table of Elements. (See Figure 1.) It is a bright yellow dense, soft, malleable and ductile metal.
Figure 1: Periodic Table of the Elements
People first mined gold about 5,000 years ago. Since that time, we have valued gold for emotional, cultural, political and economic reasons. Because of its emotional, cultural and political significance, gold has been the subject of many beliefs and false beliefs. Although this post will focus on gold’s economic aspects, it will also attempt to dispel some of the confusion and false beliefs surrounding it.
According to the World Gold Council, there were 177,200 tonnes of gold stock in existence above the ground at the end of 2013. Approximately 3,000 tonnes of new gold is mined each year, an increase in the gold stock of only 1.5% to 2.0% per year. East Asia as a whole produces 21 per cent of the total of newly-mined gold. (China is the largest single gold-producing country in the world, accounting for around 14 per cent of total production.) Latin America produces around 18 per cent of the total, with North America supplying around 15 per cent. Around 19 per cent of production comes from Africa and 5 per cent from Central Asia and Eastern Europe.
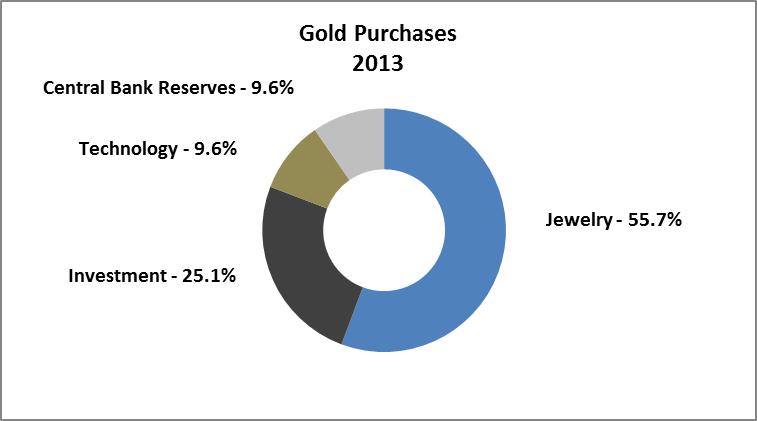
On average, 45 to 50% of the gold purchased each year is fabricated into jewelry, 30% to 35% of the gold purchased is acquired for investment purposes, 10% is purchased for manufacturing in technology and 10% is purchased by Central Banks for their reserve portfolios. During 2013, 2,370 tonnes of gold were purchased for jewelry fabrication (55.7%), 1,069 tonnes were purchased for investment (25.1%), 408 tons were purchased for technology manufacturing (9.6%) and Central Bank net purchases accounted for 409 tonnes (9.6%). (See Figure 2.)
Figure 2: Gold Purchases 2013
Is Gold Money?
Much of the confusion surrounding gold today stems from its historical role as money. The World Gold Council provides a comprehensive overview of gold’s role in the monetary system. A summary of the WGC’s overview follows.
Gold coins were first struck on the order of King Croesus of Lydia (an area that is now part of Turkey around 550 BC. Gold coins circulated as currency in many countries before the introduction of paper money. Once paper money was introduced, currencies still maintained an explicit link to gold, with the paper being exchangeable for gold on demand. By the late 19th Century, many of the world’s major currencies were fixed to gold at a set price per ounce, under the so-called Gold Standard.
Under the Gold Standard, nearly all countries either fixed the value of their currencies in terms of a specified amount of gold, or linked their currency to that of a country that did so. Domestic currencies were freely convertible into gold at the fixed price and there was no restriction on the import or export of gold. Gold coins circulated as domestic currency alongside coins of other metals and notes, with the composition varying by country. Because each currency was fixed in terms of gold, exchange rates between participating currencies were also fixed.
The classical Gold Standard existed for only about 40 years — from the 1870s until the outbreak of World War I in 1914. By 1900 all countries apart from China, and some Central American countries, were on a Gold Standard.
The Gold Standard broke down at the outset of WW I as countries resorted to inflationary policies to finance the war and, later, reconstruction efforts. In practice, only the U.S. remained on the gold standard during the war. Periodic attempts to return to a pure classical Gold Standard were made during the inter-war period, but none survived past the Great Depression.
During World War II, many believed that a new international system would be needed after the war ended to replace the Gold Standard. The design for the new system was drawn up at the Bretton Woods Conference — named after the town in New Hampshire in which it took place — in 1944. The Bretton Woods system fixed the dollar to gold at the existing parity of US$35 per ounce, while all other currencies had fixed, but adjustable, exchange rates to the dollar.
In March 1968, a two-tier gold market was introduced with a freely floating private market, but with official transactions at the fixed parity of US$35 per ounce. Finally in August 1971, President Nixon announced that the U.S. would end on-demand convertibility of the dollar into gold for the central banks of other nations. The Bretton Woods system collapsed and gold traded freely on the world’s markets.
To determine gold’s status as money today, we must first define money. According to Austrian School economists, the defining characteristic of money is its use as a medium of exchange. If Austrian School economists considered gold to be a medium of exchange today, they’d be including it in their calculation of the money supply.
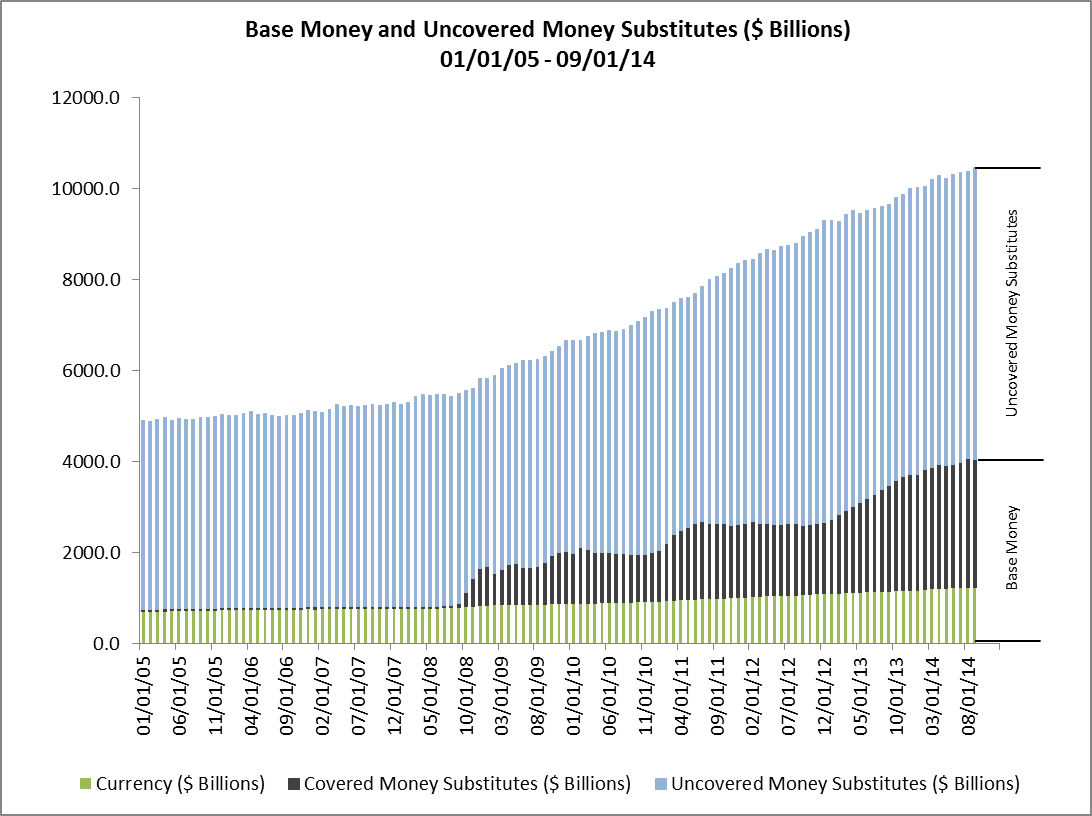
As explained by RealForecasts in its last post, however, the Austrian money supply — which RealForecasts.com refers to as the True Money Supply — is made up of Base Money and Uncovered Money Substitutes. Base Money is made up of Currency Outstanding and Reserve Deposits held by the Fed. The Uncovered Money Substitute portion of the money supply is money created by the “pyramiding” of Reserve Deposits through fractional reserve banking. (See Figure 3.)
Figure 3: Base Money and Uncovered Money Substitutes ($ Billions) 01/01/05 – 09/01/14
During periods in which gold coins circulated as part of a country’s currency and these currencies were freely convertible into gold held by central banks at a fixed price under the Gold Standard, gold was used a medium of exchange, was part of Base Money and thus was a part of the money supply. Gold was money.
Today, gold coins are no longer circulating as currency and are therefore no longer a medium of exchange. Further, since the collapse of the Bretton Woods System, gold is no longer part of Base Money and therefore is not part of the money supply. As a result, it is no longer accurate to characterize gold as money.
All that said, many investors purchase gold as a hedge against the debasement and possible collapse of a fiat currency. They believe that gold will regain its status as money If the fiat currency collapses. Because of gold’s potential to become an integral part of the monetary system once again, a case can be made to characterize gold as “contingent money”.
Is Gold A Good Investment?
In investment circles, gold is categorized as a “real asset” as compared to a “financial asset”. Real assets are physical or tangible assets that have value, due to their intrinsic qualities and properties. Real assets include precious metals like gold, commodities, real estate, agricultural land and oil. Financial assets or “paper assets” derive their value from a contractual claim. Stocks, bonds and bank deposits are all examples of financial assets.
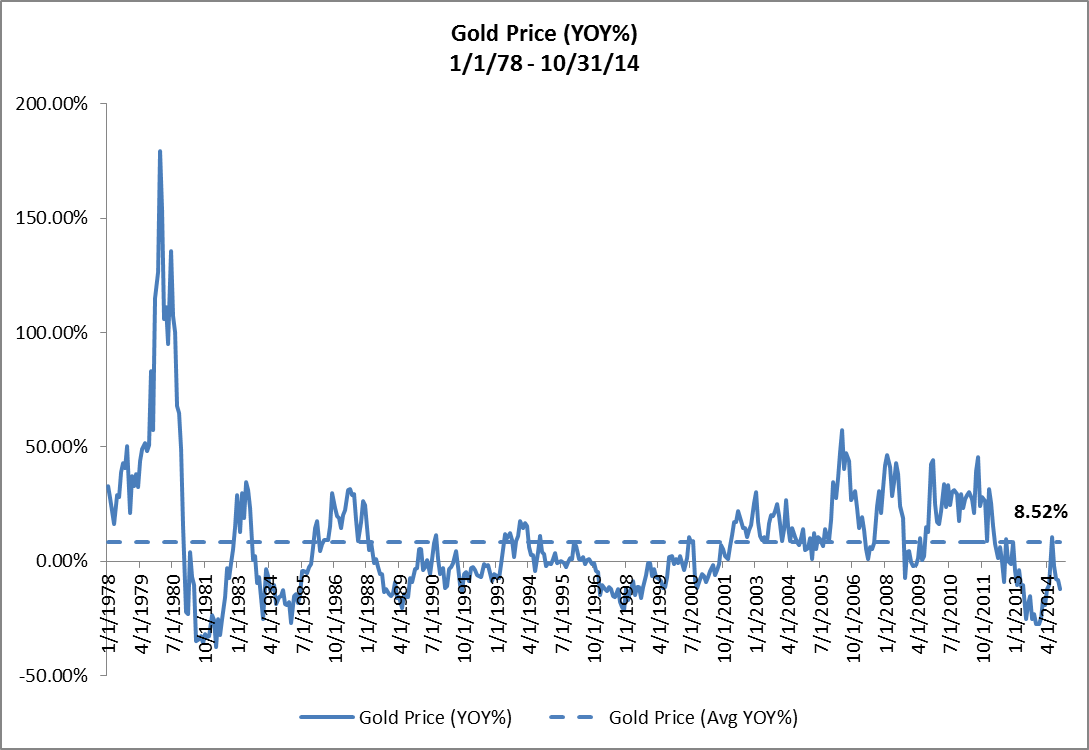
So is gold a good investment? Since 1978, the price of gold has reported an average increase of 8.52%, year-over-year. (See Figure 4.)
Figure 4: Gold Price (YOY%) 1/1/78 – 10/31/14
Whether an asset is a good investment, however, depends upon a number of factors such as the investor’s investment style, risk tolerance, investment time horizon and investment objectives. For example, Warren Buffett is generally known as a buy-to-hold “value investor” in the tradition of Benjamin Graham and David Dodd. As the name suggests, value investors buy financial assets that appear under-priced based upon some form of fundamental analysis. It’s not surprising that a value investor like Buffett would eschew a real asset like gold.
On the other hand, diversified investors who follow the tenets of Modern Portfolio Theory — as pioneered by Harry Markowitz in the 1950s — are attracted to real assets like gold because they lack correlation with financial assets, which allows them to diversify their portfolios and reduce portfolio volatility. Still other investors choose gold as a hedge against both inflation and currency risk. Gold’s usefulness as a hedge against currency risk is illustrated in Figure 5.
Figure 5: Gold Price (YOY%) v. US Dollar Index (YOY%) 1/1/78 – 10/1/14
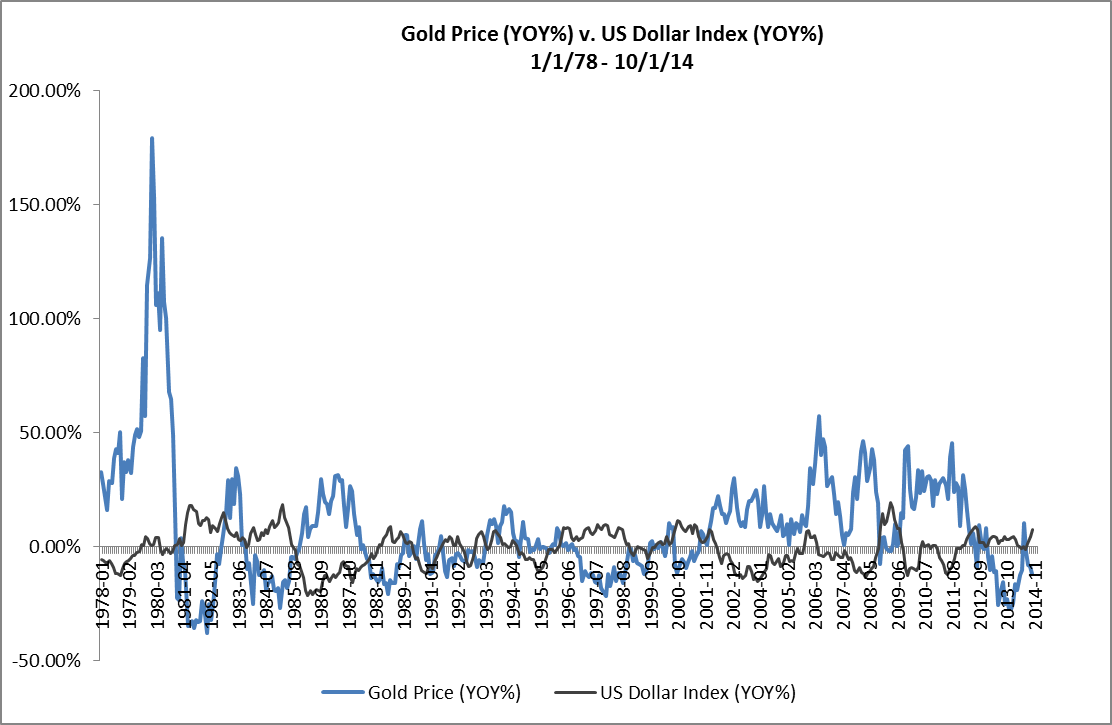
Note the very strong inverse correlation between the growth rate of the gold price and the growth rate of the price of the U.S. Dollar relative to other major currencies.
U.S. Dollar Index and Gold Price Forecasts
Consistent with Austrian Business Cycle Theory, we can use the growth rate of TMS to forecast the growth rate of both the U.S. Dollar Index and Gold Price. The very strong inverse correlation between the growth rate of the U.S. Dollar Index and the growth rate of the True Money Supply (TMS) is shown in Figure 6.
Figure 6: U.S. Dollar Index (YOY%) v. True Money Supply (YOY%) 1/1/78 – 10/01-14
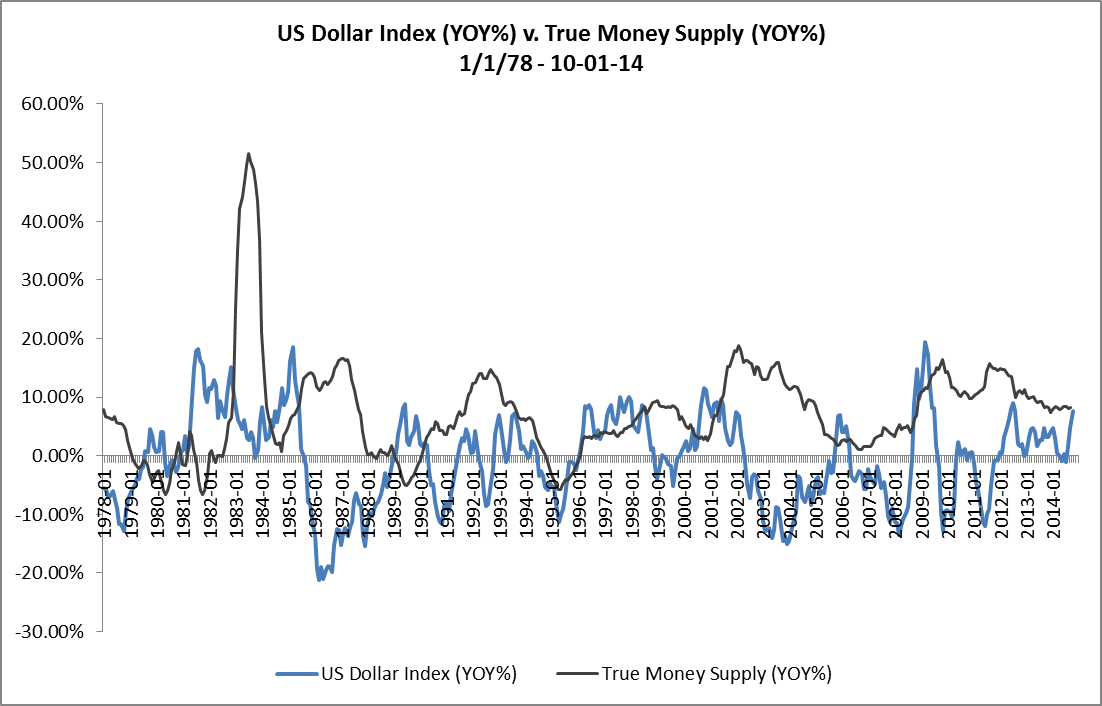
If the Fed expands the U.S. money supply at a faster rate than the central banks of the countries of other major currencies expand their money supply, the laws of supply and demand suggest that the price of the U.S. Dollar should fall relative to the other currencies (all else being equal). Conversely, if the Fed expands the U.S. money supply at a slower rate than the other central banks expand their currencies, the price of the U.S. Dollar should rise relative to the other currencies. The chart in Figure 6 certainly supports these suggestions.
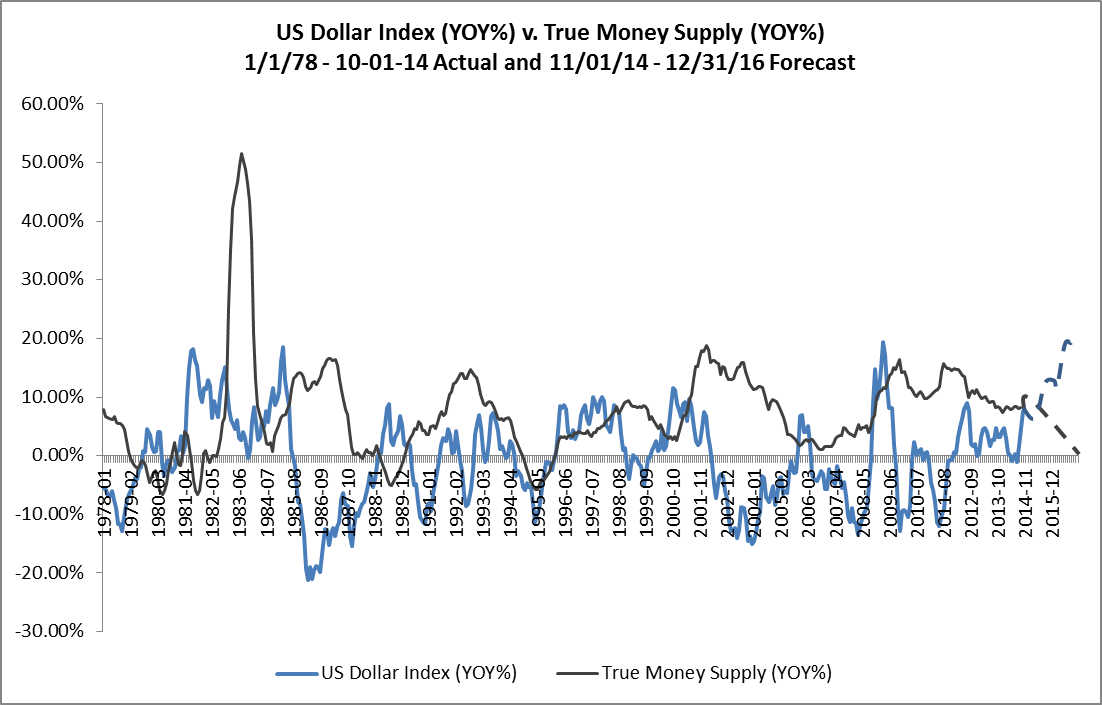
In its previous post, RealForecasts,com forecasted the continued deceleration in the growth of TMS through the end of 2016. If during the same period the European Central Bank, Japanese Central Bank and others accelerate the growth of TMS for their currencies, look for the US Dollar to continue to strengthen and the US Dollar Index to continue to rise. (See Figure 7.)
Figure 7: US Dollar Index (YOY%) v. True Money Supply (YOY%) 1/1/78 – 10-01-14 Actual and 11/01/14 – 12/31/16 Forecast
Because of the strong inverse correlation between the price of gold and the U.S. Dollar Index, when the U.S. Dollar strengthens and the U.S. Dollar Index rises, the Gold Price will likely fall. (See Figure 8.)
Figure 8: Gold Price (YOY%) v. US Dollar Index (YOY%) 1/1/78 – 10/1/14 Actual and 11/01/14 – 12/31/14 Forecast

When the next financial crisis occurs, however, watch for the Gold Price and the U.S, Dollar Index to reverse, with the growth rate of the U.S. Dollar Index decelerating and even decreasing and the growth rate of the price of gold accelerating sharply.
This forecast is not only predicated on the Fed continuing its current policy stance, but also on the other major central banks continuing their policy stances. In the event the Fed or the other central banks adjust their policy stances, it will also be necessary to adjust this forecast in light of the changed policies. Continue to check back with RealForecasts.com for future updates.
As always, thanks to J. Michael Pollaro, author of The Contrarian Take, for the TMS data used to construct the charts in this article. To see more of Michael’s TMS data, go to http://blogs.forbes.com/michaelpollaro/austrian-money-supply/.