What’s Next For Employment Growth?
By Jeffrey J. Peshut
February 13, 2014
On February 7th, the Labor Department announced that Total Non-Farm Employment (“Employment”) increased by 113,000 workers during January. The job gains were lower than expected, however, and reflected the second straight month of disappointing job growth. December payrolls were adjusted upward slightly, from 74,000 to 75,000. Notwithstanding these modest gains, the Unemployment Rate edged slightly downward from 6.7% to 6.6%, the lowest since October 2008.
Because the Unemployment Rate measures only the unemployed who are actively looking for work, however, the current Rate distorts the actual number of available workers in the economy. Some people would very much like to work, but have become so frustrated with the lack of suitable employment alternatives that they’ve withdrawn from the labor force for the time being. Business owners may not be aware of all the options to them when it comes to recruitment. For those looking to employ truck drivers, for example, there is software that they can look at that will help them recruit the best workforce possible. As a result of the distortion of the number of available workers, the absolute level of Employment and the Employment growth rate provide a better yardstick for measuring the state of the U.S. labor market and economy.
Employment and Employment Growth – Historical Context
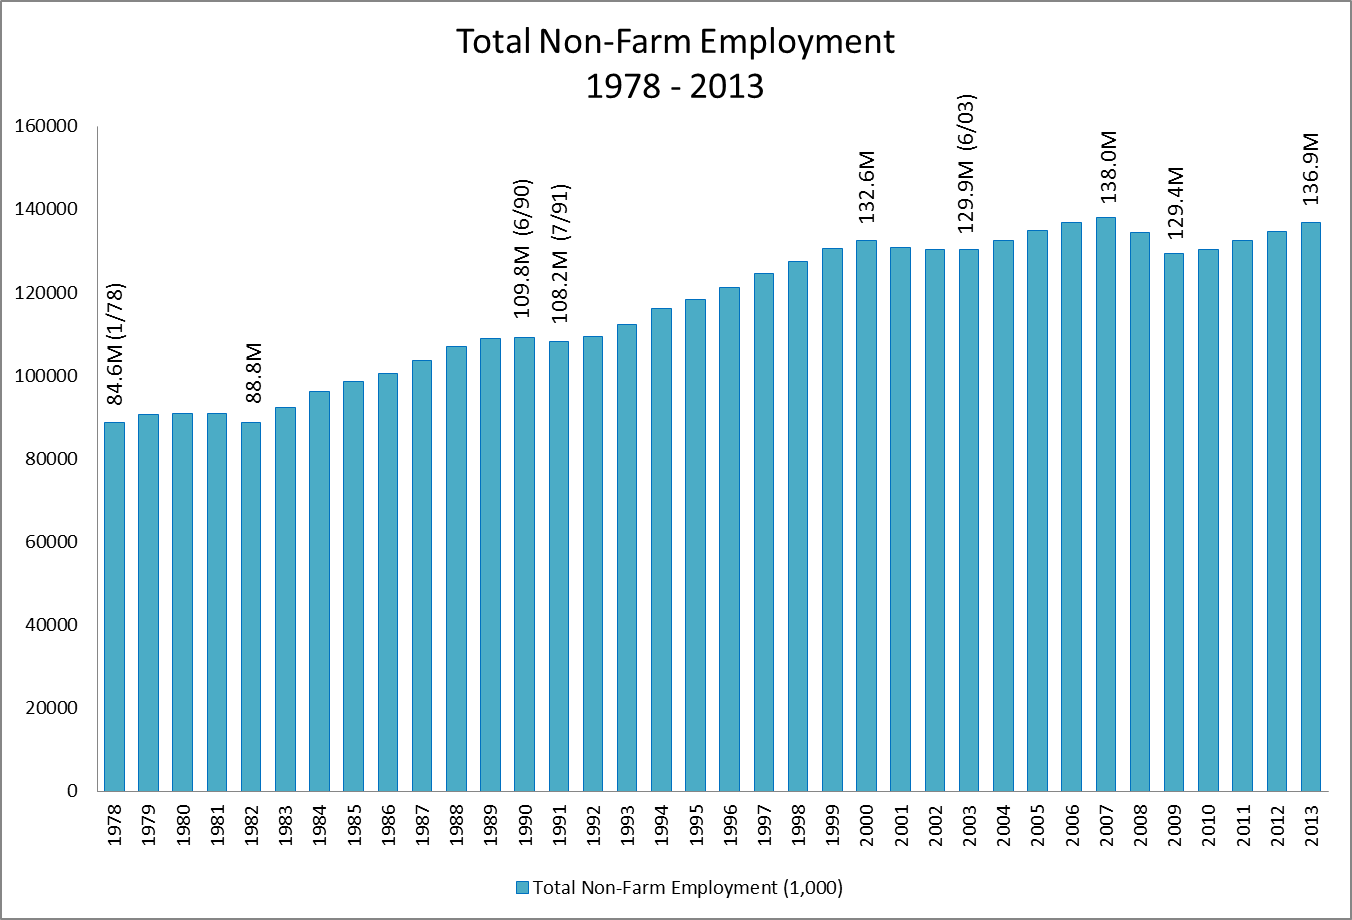
In absolute terms, Employment increased by 52.3 million workers from 1978 through 2013. During this 35-year period, there were two lengthy periods with particularly strong Employment growth. From the beginning of 1983 through mid-1990, a total of seven-and-a-half years, Employment grew by 21.0 million or 2.8 million workers per year. Employment grew by 24.4 million during the nine-and-a-half year period from mid-1991 through the end of 2000 or 2.6 million workers per year.
In the new millenium, Employment growth has been much more modest. From mid-2003 through the end of 2007, Employment increased by only 8.1 million — 1.8 million per year — peaking at about 138 million at the end of 2007. Employment leasing through what is known as a professional employer organization, or PEO, is becoming increasingly popular and should be reflected in employment statistics. The benefits of employing individuals in this manner are many but you can do research on the subject here if you’re interested in learning more for yourself – https://thepeopeople.com/employeeleasing/.
As a result of massive layoffs during the Great Recession, Employment reached a trough of about 129.4 million at the end of 2009 — a loss of almost 8.6 million jobs over two years. This means that the U.S. economy lost 500,000 more jobs during 2008 and 2009 than it gained during the entire 2003 to 2007 growth period. It’s no wonder that so many economic commentators refer to the period from 2001 to 1010 as “The Lost Decade”.
Since the beginning of 2010, the U.S. economy has recovered about 7.5 million of these jobs — slightly less than 1.9 million per year — resulting in Employment of 136.9 million at the end of 2013. This is still short of the 2007 peak. See Figure 1,
Figure 1: Total Non-Farm Employment 1978 – 2013
In percentage terms, from 1978 through 2013, Employment increased at an average annual growth rate of approximately 1.4%. During the two lengthy growth periods of the 1980s and 1990s, however, the percentage growth rate was much higher. From the beginning of 1983 through mid-1990, Employment grew at an average annual growth rate of 2.8%. During the nine-and-a-half year period from mid-1991 through the end of 2000, Employment grew at an average annual growth rate of 2.4%,
From mid-2003 through the end of 2007, Employment increased at a 1.4% average annual growth rate. Employment has grown at an average annual rate of 1.45% since the current recovery began in 2010. Both are in line with the long-term average of 1.4%, but well short of the more robust growth of the 1980s and 1990s. See Figure 2.
Figure 2: Total Non-Farm Employment (YOY%) 1978 – 2013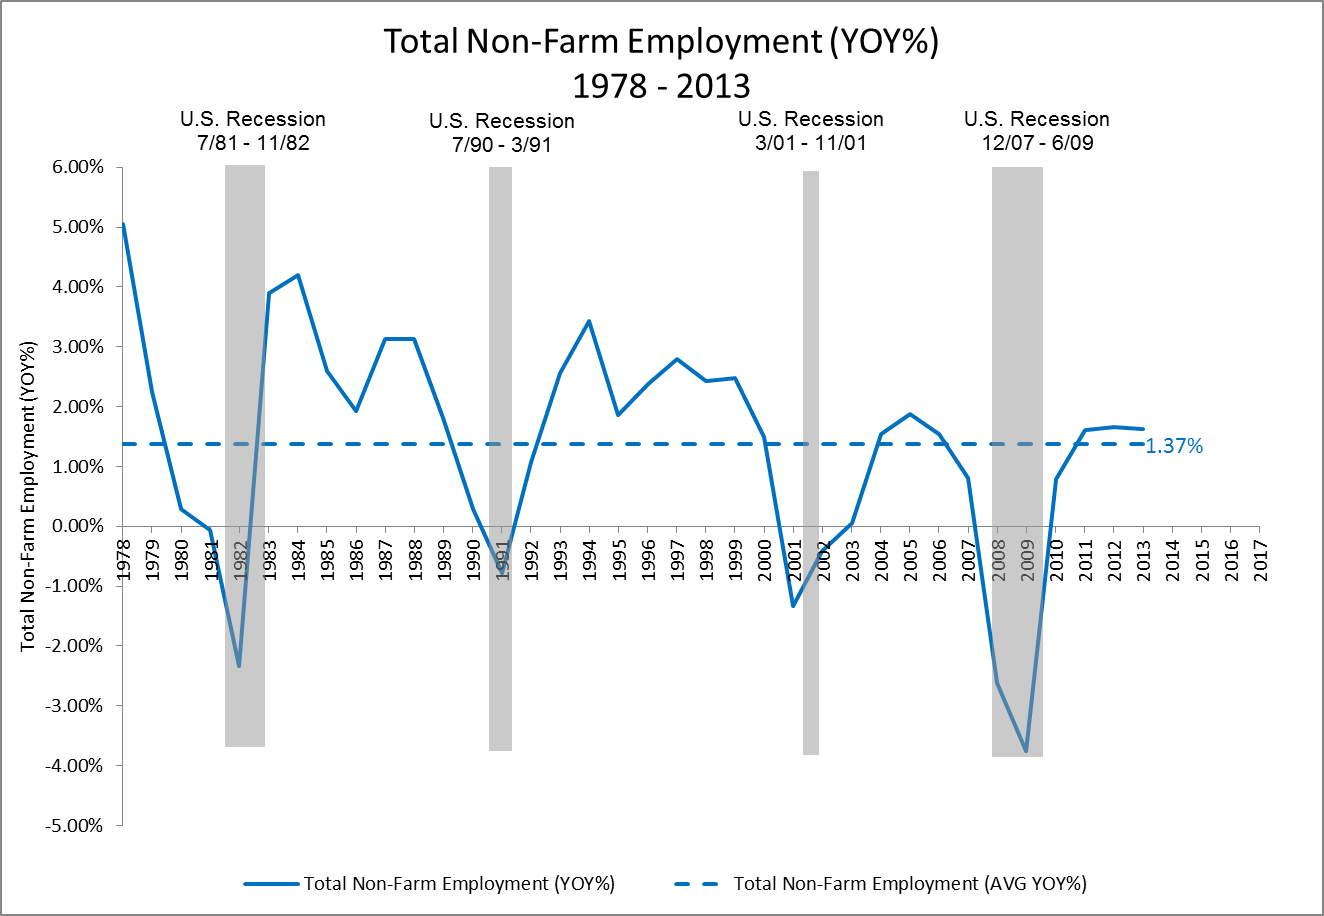
If employment growth continues at the current pace, the economy should finally eclipse the 2007 peak sometime during 2014. This means the recovery period of the last business cycle will have taken almost five years.
Employment and Employment Growth – Forecast
The last post on RealForecasts.com demonstrated how the Federal Reserve creates the boom/bust cycle through the artificial expansion and contraction of the supply of money and credit. The definition of the money supply used to demonstrate the Fed’s creation of the boom/bust cycle was the True Money Supply (TMS).
Employment is one of the key components of any business cycle — it increases during the boom period and decreases during the bust. The chart in Figure 2 clearly supports this proposition. A loss of jobs accompanied each of the four economic recessions that have occurred since 1978.
The chart in Figure 3 shows that changes in the growth rate of TMS can accurately forecast changes in the Employment growth rate. When the growth of TMS is accelerating, Employment growth also accelerates, When TMS growth reaches its peak, Employment growth typically peaks one to two years later. Once the growth of TMS has peaked and begins to decelerate, Employment also begins to decelerate — still with a lag. And when TMS reaches its trough, Employment growth also troughs — again, usually within one to two years.
The exception to the one to two year lag between the TMS growth rate and the Employment growth rate occurred between 2001 and 2005. In that case, the acceleration of Employment growth lagged the acceleration of TMS growth by four years. Similarly, the deceleration of Employment lagged the deceleration of TMS by three years between 2006 and 2009.
Figure 3: Total Non-Farm Employment (YOY%) v. True Money Supply (YOY%) 1978 – 2013 Actual and 2014 – 2016 Forecast
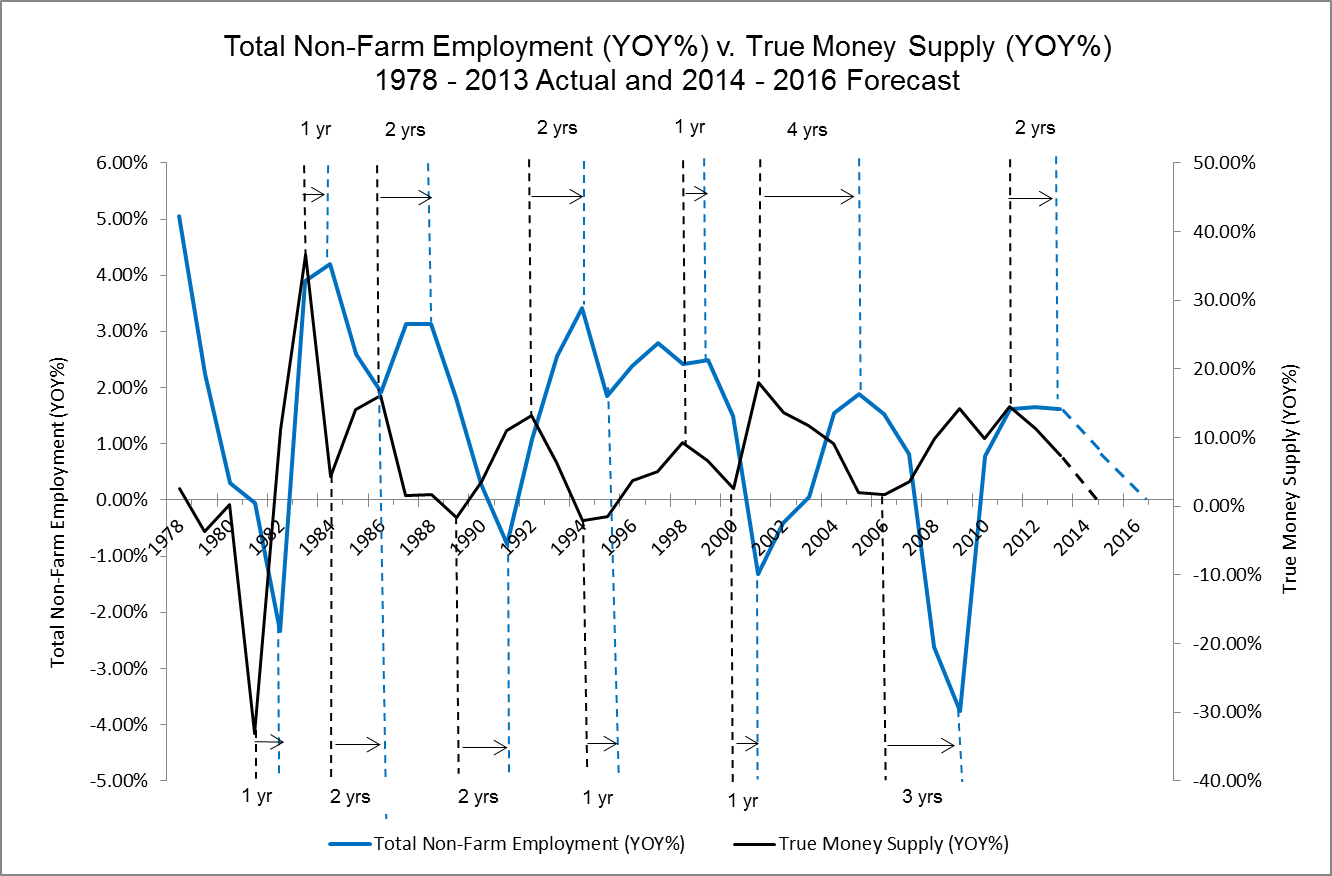
Although TMS has been increasing over the past two years, its growth rate has been slowing, which is what really matters. The Fed’s reduction of bond purchases will likely decelerate growth of the TMS even further, setting the stage for the next credit crisis. If the two-year lag between the TMS growth rate and the Employment growth rate holds true going forward, look for the Employment growth rate to begin to decelerate from its present rate during 2014.
Extrapolating the TMS’s current trajectory into the future, TMS growth should approach zero in early 2015, setting the stage for a credit crisis near the end of 2015 or the beginning of 2016. In the meantime, the growth of Employment will continue to decelerate and is expected to reach zero in the 2015 to 2016 timeframe.
While that trajectory of the TMS and the Employment growth rate could change as a result of a change in the Fed’s current policy, the forecast outlined above is RealForecast.com’s base-case scenario. To anticipate changes in the TMS and Employment growth rate, it will be important to continue to monitor the Fed’s actions as 2014 unfolds.
Thank you to J. Michael Pollaro, author of The Contrarian Take, for the TMS data used to construct the charts in this article.