By Jeffrey J. Peshut
March 4, 2014
On February 28th, the Commerce Department released its revised estimate of real Gross Domestic Product growth for the fourth quarter of 2013, reducing it from January’s original estimate of 3.2% to 2.4%. Both are down from the third quarter’s GDP growth of 4.1%. For the entire year, real GDP grew by only 1.9% after expanding by 2.8% in 2012.
What are people saying about this news? Many are wondering whether the weak economic data represent a mere seasonal speed bump on the road to a continued economic recovery or a harbinger of a loss of momentum in economic activity.
In her appearance before the Senate banking committee last week, new Federal Reserve Chair Janet Yellen acknowledged that “we have seen quite a bit of soft data over the last month to six weeks”, referring to disappointing data about industrial production, employment, the housing market and retail sales. “What we need to do . . . is to try to get a firmer handle on exactly how much of that set of softer data can be explained by weather and what portion if any is due to a softer outlook,” she added.
Because this writer lacks the meteorological skills ostensibly possessed by Ms. Yellen and others at the Fed, RealForecasts.com will limit its analysis to data associated with GDP and the money supply.
Gross Domestic Product and Gross Domestic Product Growth – Historical Context
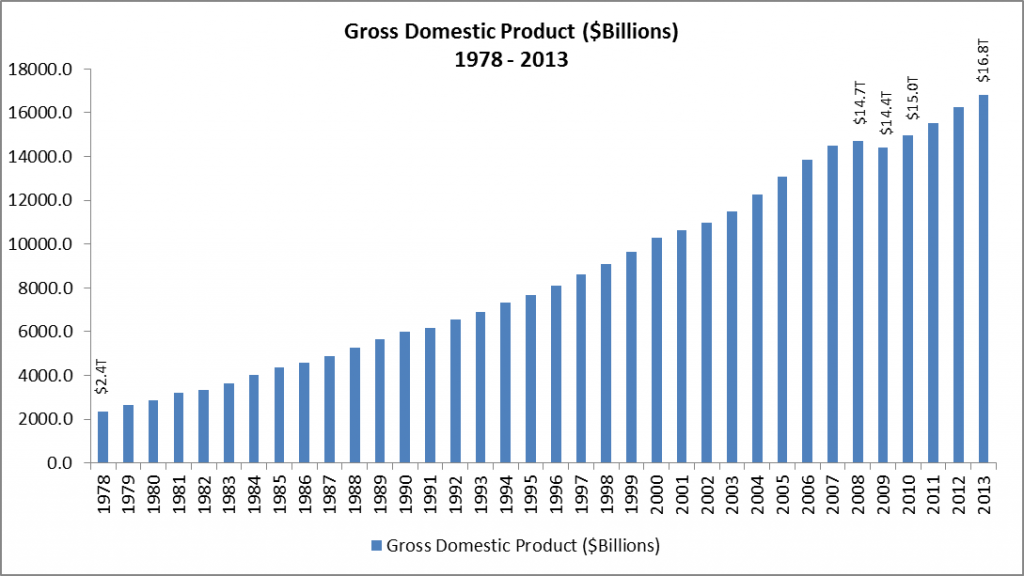
In current dollars, Gross Domestic Product increased from $2.4 trillion in 1978 to $16.8 trillion in 2013, a total of $14.4 trillion and an average of approximately $411.4 billion per year Although there have been four economic recessions in the U.S. since 1978 — traditionally defined as two consecutive quarters of negative GDP growth — 2009 was the only year during that period in which GDP was less than it was in the previous year. See Figure 1,
Figure 1: Gross Domestic Product ($Billions) 1978 – 2013
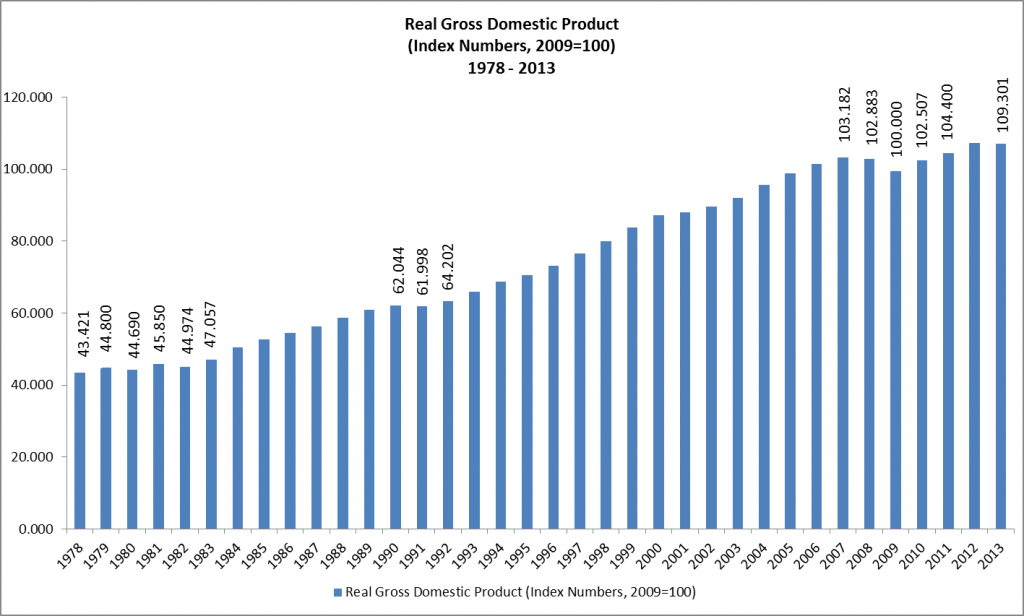
Because nominal GPD includes increases in production due to price changes, economists prefer to remove the effects of price inflation and use real GDP to determine how much the economy has actually grown from one year to the next. Real GDP for 1978 to 2013, calculated as index numbers with 2009 equal to 100, is shown in Figure 2. Real GDP fell in 1980, 1982, 1991, 2008 and 2009 and didn’t surpass its 2007 level until 2011.
Figure 2: Real Gross Domestic Product (Index Numbers, 2009=100) 1978 – 2013
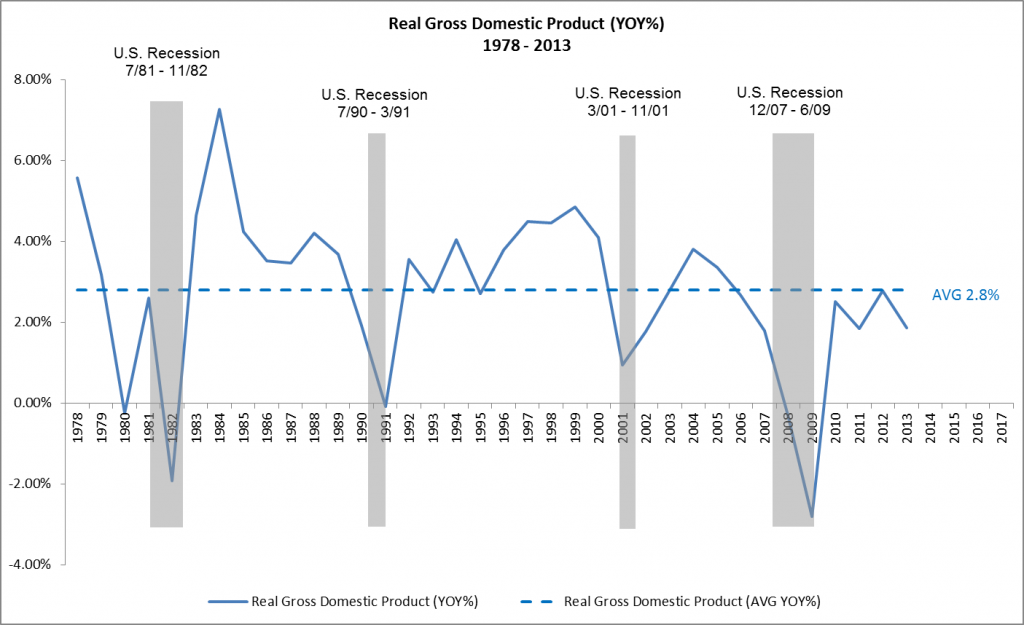
In percentage terms, real GDP increased at an average annual growth rate of approximately 2.8% from 1978 through 2013. See Figure 3. This time period included four recessions and two longer periods of above-average growth (1983 – 1989 and 1992 – 2000) followed by one shorter period (2003 – 2006) of above-average growth.
Since 2001, however, real GDP has grown at an average annual rate of only 1.8%. From 2001 through 2009 it grew even more slowly — reporting an anemic average annual rate of 1.56%. In the four years since the end of The Great Recession, real GDP has fared slightly better, posting an average annual rate of 2.25%.
Figure 3: Real Gross Domestic Product (YOY%) 1978 – 2013
Gross Domestic Product Growth – Forecast
Two posts ago, in Does The Federal Reserve Really Create The Boom/Bust Cycle?, RealForecasts.com explained how the Federal Reserve does indeed create the boom/bust cycle through the artificial expansion and contraction of the supply of money and credit. The definition of the money supply used to demonstrate the Fed’s creation of the boom/bust cycle was the True Money Supply (TMS).
Because a recession is defined as two consecutive quarters of negative GDP growth, GDP is the key indicator of any business cycle. The chart in Figure 3 shows the relationship between a decrease in GDP and the declaration of a recession. A sharp drop in real GDP accompanied each of the four economic recessions that have occurred since 1978.
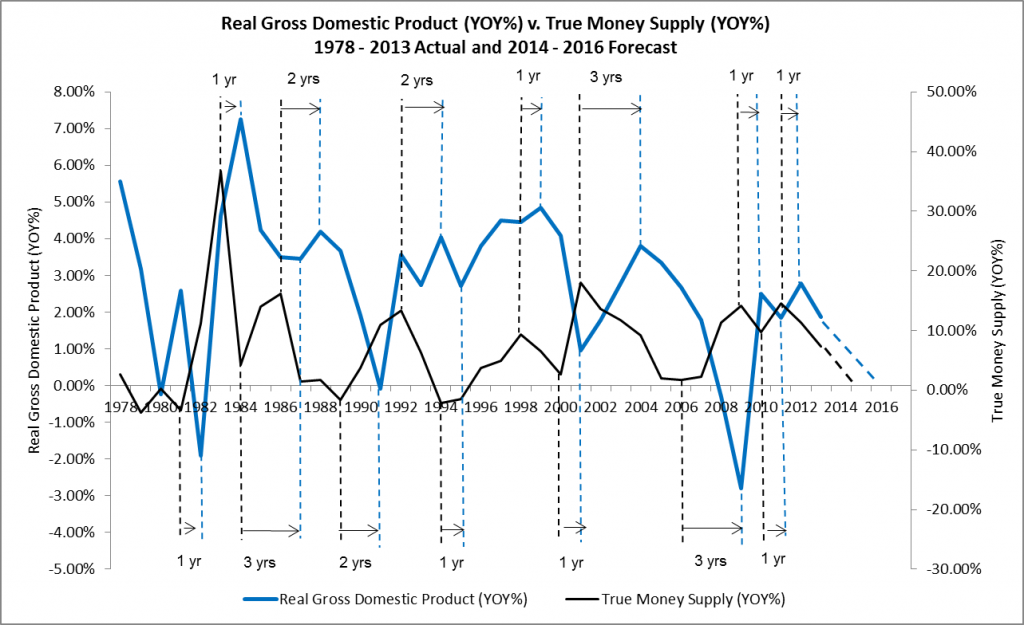
The chart in Figure 4 shows that changes in the growth rate of TMS can accurately forecast changes in the growth rate of GDP. When the growth of TMS is accelerating, GDP growth also accelerates. When the TMS growth rate reaches its peak, the GDP growth rate also typically peaks, but with a one to two year lag. Once the rate of growth of TMS has peaked and begins to decelerate, GDP’s rate of growth also begins to decelerate — still with a lag. And when the TMS growth rate reaches its trough, the GDP growth rate also troughs — again, usually within one to two years.
Exceptions to the one to two year lag between the TMS growth rate and the GDP growth rate occurred between 1984 and 1987, 2001 and 2004 and 2006 and 2009. In the first instance, from 1984 to 1987, the deceleration of GDP growth lagged the acceleration of TMS growth by three years . Similarly, the acceleration of GDP lagged the acceleration of TMS growth by three years from 2001 and 2004 and the deceleration of GDP lagged the deceleration of TMS by three years between 2006 and 2009.
Figure 4: Real Gross Domestic Product (YOY%) v. True Money Supply (YOY%) 1978 – 2013 Actual and 2014 – 2016 Forecast
Although TMS has been increasing over the past two years, it’s been increasing at a decreasing rate, which is what really matters. The Fed’s reduction of bond purchases will likely decelerate the growth of TMS even further, setting the stage for the next credit crisis.
Extrapolating the TMS’s current trajectory into the future, TMS growth should approach zero in early 2015, setting the stage for a credit crisis near the end of 2015 or the beginning of 2016. Based upon a one-year lag between the TMS growth rate and the GDP growth rate since 2009, the growth rate of GDP is expected to approach zero in early 2016.
Of course, the trajectory of the TMS and GDP growth rates could change as a result of a change in the Fed’s current policy. Referring to the possibility that the Fed will reconsider its current tapering policy, Ms. Yellen said, “If there is a significant change in the outlook, certainly we would be open to reconsidering, but I wouldn’t want to jump to any conclusions.” For this reason, the forecast in the preceding paragraph is RealForecast.com’s base-case scenario. To anticipate changes in the TMS and GDP growth rates, RealForecast.com recommends that readers continue to monitor the Fed’s actions as 2014 unfolds.
Thank you to J. Michael Pollaro, author of The Contrarian Take, for the TMS data used to construct the charts in this article.


Wow, very impressive article. I hope your zero growth rate is wrong, though, although I think you will be a lot closer than what the administration is assuming in their new budget.