Editor’s Note: This is the second post for RealForecasts.com. For its second post, RealForecasts.com is re-publishing a white paper titled “Is There a Real Estate Bubble?”, which was written in September of 2005. Not only were there were bubbles in both the residential and commercial real estate capital markets, but the bursting of these bubbles that began in August of 2007 precipitated the greatest economic downturn in the U.S. since The Great Depression of the 1930s.
Is There a Real Estate Bubble?
By Jeffrey J. Peshut
September, 2005
The question on the minds of most real estate investors today is whether there is a “bubble” in the real estate capital markets and, if so, when will it “burst”. I wrote the [previous post titled “Will Market’s Boom/Bust Cycle Repeat?”] in mid-1998. The question then was whether there was a bubble in the stock markets and economy and, therefore, the real estate space markets. Hindsight tells us that there was in fact a bubble in all three, as these bubbles burst about 18 months later.
Is There A Bubble?
Those who argue that there are bubbles in both the residential and commercial real estate capital markets today make the following case:
– We are once again nearing the end of a “credit-fueled” bubble similar to the credit-fueled bubbles that ended during the late 1980’s and late 1990’s.
– The Federal Reserve and commercial banks cause these bubbles by artificially expanding the supply of money and credit. The Fed expands the supply of money and credit by buying Treasury Bills in the open market or by lowering the discount rate as a means of lowering short-term interest rates. This expansion of the money base is magnified by the impact of fractional-reserve banking.
– When the Fed pumps money into the economy, interest rates drop — at least at first.
– As the commercial banks’ reserves increase and interest rates decrease, businesses take out bank loans to invest in projects that weren’t profitable at the higher interest rates previously set by the free market. As businesses hire workers and buy equipment and raw materials to implement their investment plans, the economy picks up and the boom phase of the cycle begins.
– The boom, however, is founded upon an illusion. The government appeared to enlarge the pool of savings available for businesses to invest, but in reality it created money that didn’t exist before. It’s this money that was created “out of thin air” that creates the bubble.
– After all, the government can’t create wealth or real savings. It can only confiscate and redistribute existing wealth through taxation or inflation. When the Fed reduces interest rates by inflating the money supply, it in effect confiscates part of our wealth by inflation and lends our money to borrowers at the below-market rates referenced above.
– This subsidized interest rate sends a false signal to businesses, encouraging them to invest in projects that consumers weren’t in fact willing to pay for.
– Alas, all credit-fueled bubbles must end. Otherwise, we risk hyper-inflation or a collapse in the value of the dollar relative to other currencies.
– To end the bubble, the Fed must reverse its earlier policy and contract the supply of money and credit.
– During the late 1980’s, concerns about the rate of inflation for goods and services and a weak dollar lead the Federal Reserve to drastically tighten credit and end the bubble. During the late 1990’s, “irrational exuberance” in the stock market led the Fed to tighten credit and end that bubble. Today, concerns about a “housing bubble” and a weak dollar seem to be the impetus behind the Fed’s increasingly tight monetary policy.
– When credit-fueled bubbles end, they burst. And when they burst, the ill-advised investments that businesses made during the period of the Fed’s loose monetary policy are exposed.
According to this line of thinking, the question of whether the “bubble” in the real estate capital markets will “burst” becomes not “if” but “when”. And once it does, by “how much” will values decline.
If So, When Will It Burst?
To attempt to answer the “when” question, I offer the following observations:
– During the last “credit-fueled” bubble, the rate of growth in the money supply reached its peak in mid-1998 and its trough in late-2000. This correlates closely with the Fed’s “loose” monetary policy from early-1995 through early-1999 and its “tight” monetary stance from early-1999 through late-2000. See the following [Fed Funds Rate and REAL Money Supply (RMS) graphs. See also “The Mystery of the Money Supply Definition” by Frank Shostak (The Quarterly Journal of Austrian Economics Vol. 3, NO. 4 (Winter 2000): 69–76.) REAL Money Supply represents the true definition of the money supply outlined in Dr. Shostak’s article.]
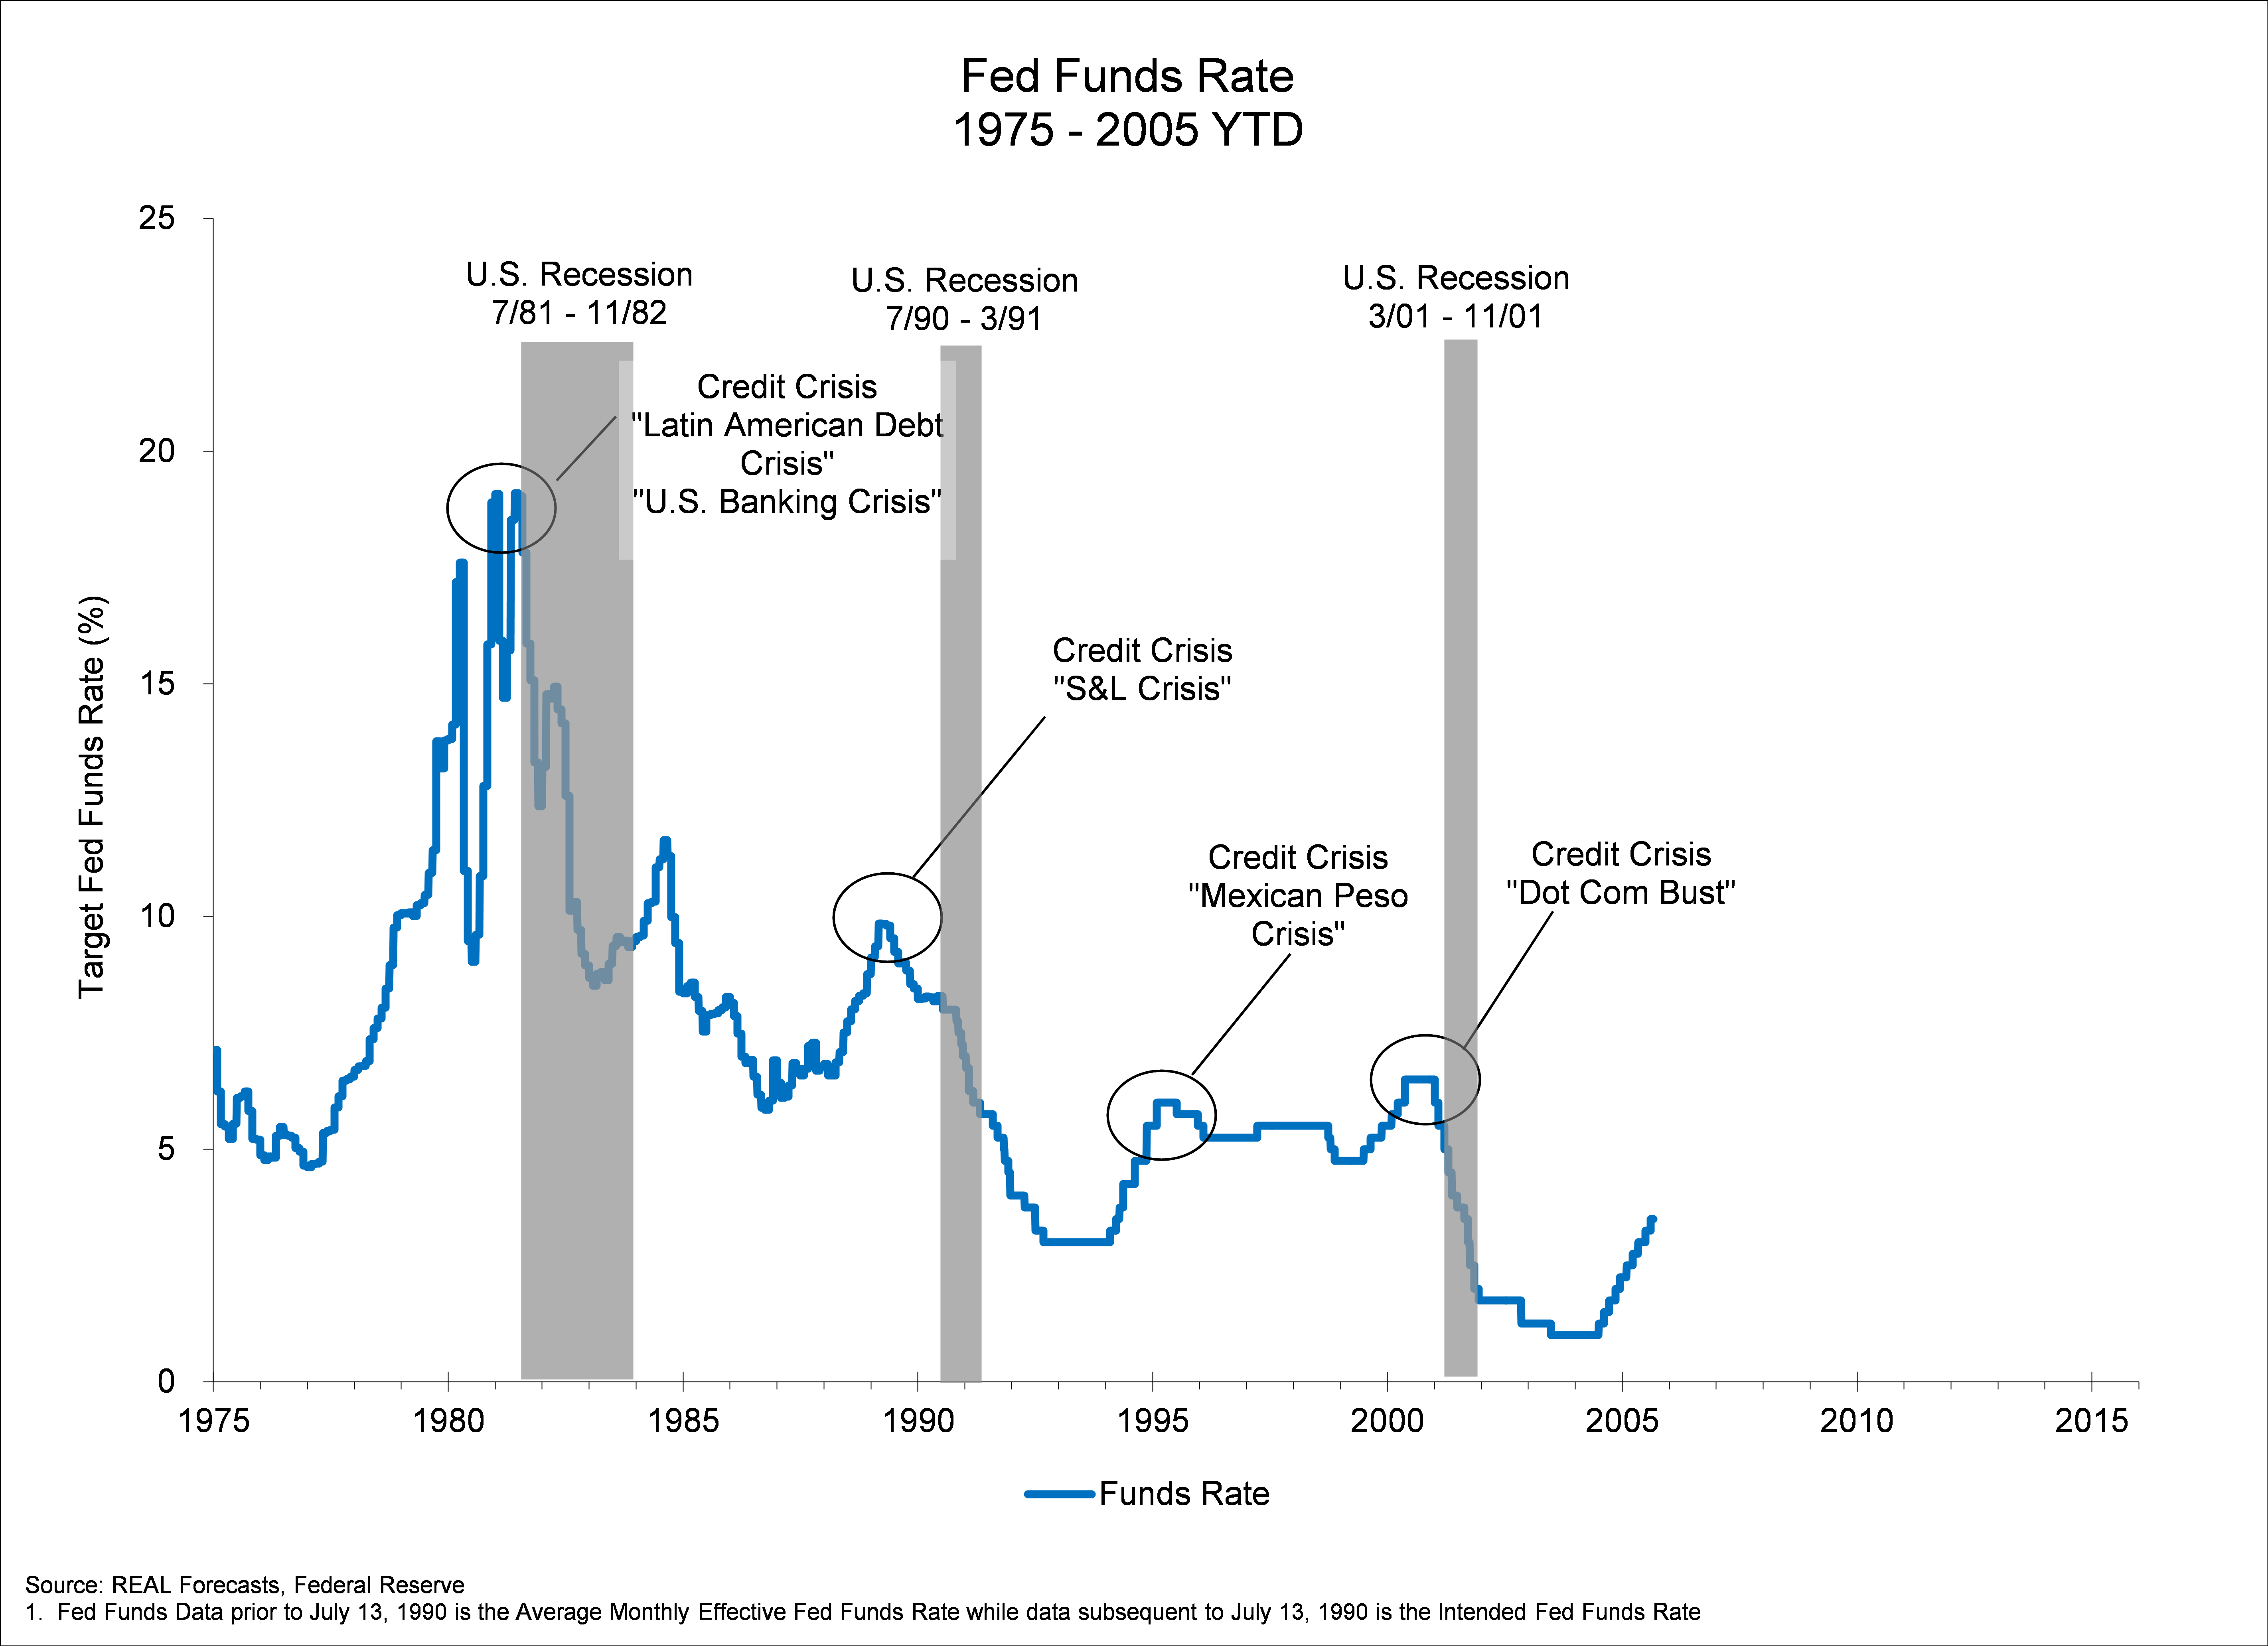
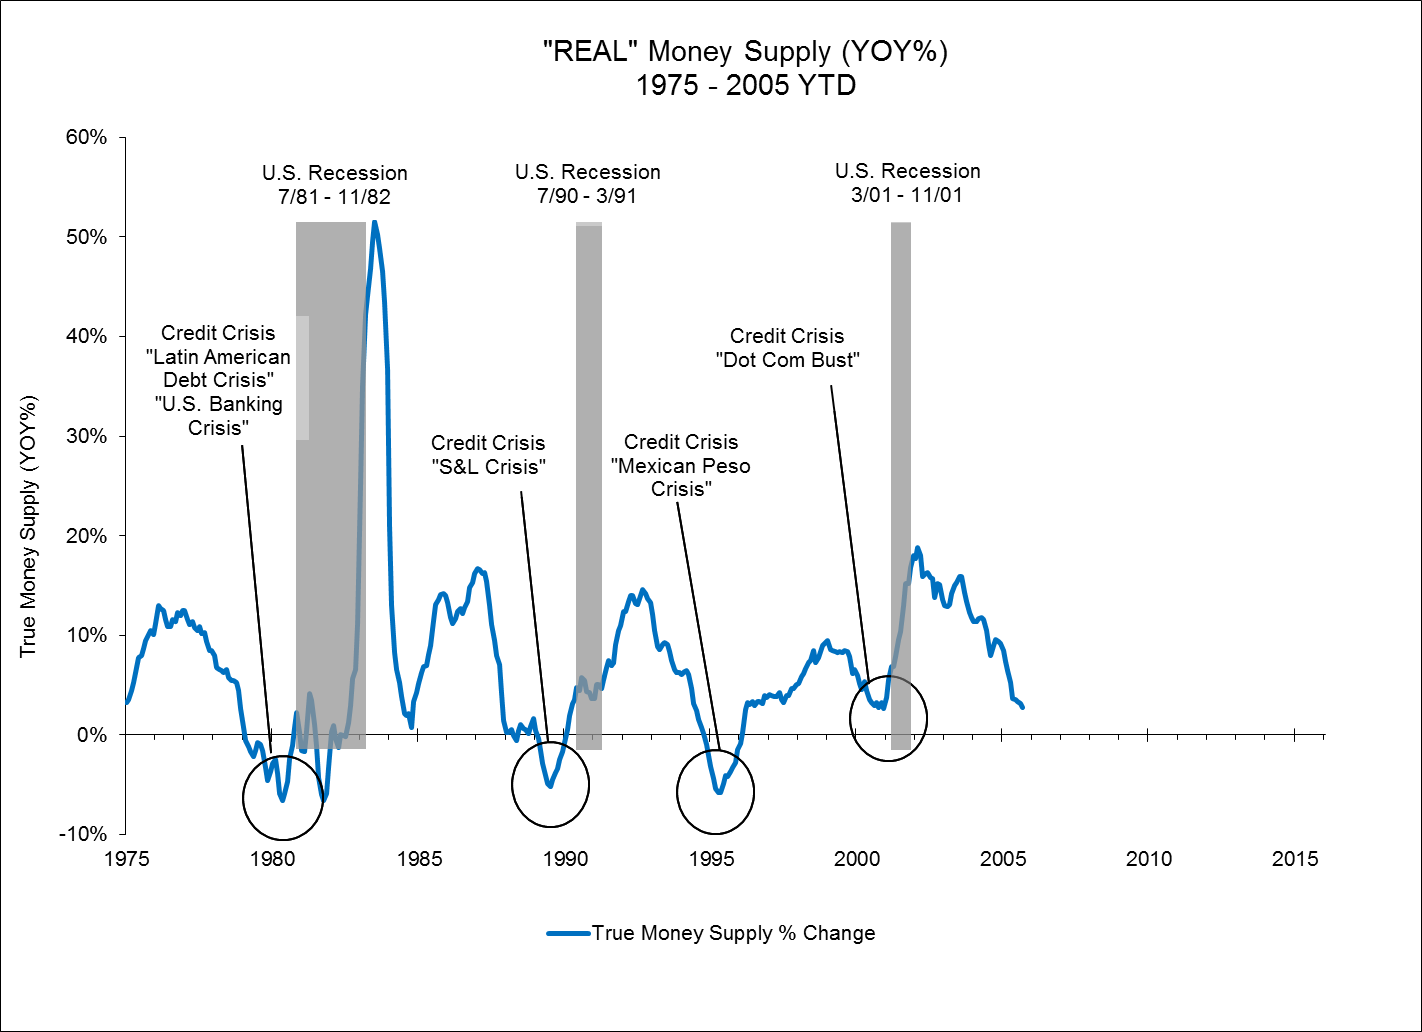
– During what is arguably the most recent “credit-fueled” bubble, the rate of growth in the money supply reached a peak in early-2002 and again in early-2004, before beginning its current descent. Again, this correlates closely with the Fed’s loose monetary policy from late-2000 through early-2004 and its tight monetary stance since early-2004. It also correlates closely with the most recent run-up in prices in the residential and commercial real estate capital markets.
– Recently, [RMS has] been increasing at a decreasing rate. “Real [RMS]” ([RMS] adjusted for price inflation) correlates closely with changes in Industrial Production – a key measure of economic activity — with a 12-month lag. “Adjusted [RMS]” ([RMS] adjusted for price inflation and economic activity) correlates closely with changes in the stock markets, with a 4-month lag.
If past is prologue, the effect of the Fed’s current tight monetary stance on the money supply’s growth rate creates a significantly heightened risk of a slowdown in economic activity, a correction in the stock markets and a correction in the real estate capital markets in the year ahead.
How Much Will Values Decline?
With respect to the question of “how much” values will decline, the following observations are noteworthy:
– From 1995 through 2004, the spread between going-in cap rates and the 10-year Treasury averaged 320 bps.
– A year ago, going-in cap rates and 10-year unlevered IRR’s were 7.0% to 7.5% and 8.25% to 8.75%, respectively. These going-in cap rates represented a spread of approximately 280 to 330 bps over the 10-year Treasury, consistent with the historical average.
– Today, going-in cap rates and 10-year unlevered IRR’s are 5.75% to 6.25% and 7.0% to 7.25%, respectively, for “core” real estate investments. The going-in-cap rate represents a spread of approximately 155 to 205 bps to today’s 10-year Treasury.
– This spread is not only narrow for cap rates, but would also be narrow for commercial mortgage spreads. From 1996 through year-to-date 2005, the spread between commercial mortgages and the 10-year Treasury averaged 190 bps.
– According to L.J. Melody, today’s rates for fixed-rate commercial mortgages are 4.9 % to 5.5% for the four major property types. These rates represent a spread of 70 to 130 bps over the 10-year Treasury, approximately half the historical average.
– Therefore, it appears that last year’s cap rate levels were sustainable based upon historical averages but that the 125 bps decline in cap rates and IRR’s during 2005 will prove to be unsustainable.
– For a property with NOI of $5 million, a 125 bps increase in today’s going-in cap rates would result in a decline in value of 17% to 18%. It is important to note that this decline in value reflects only a return of the going-in cap rate spread to its historical average. It does not reflect a change in the 10-year Treasury rate.
– It is also important to note that a 17% to 18% decline in value requires a 20% to 22% increase in value to return to the value that existed before the decline.
One final observation: Once bubbles burst and market values decline, market values typically take a long time to recover. For example, five years after the bubbles in the stock markets burst, the Dow Jones Industrial Average is still only 90% of the all-time high it set in early-2000. Similarly, the S&P 500 Index and the NASDAQ Composite Index are only 80% and 45%, respectively, of their 2000 all-time highs. Therefore, once the real estate bubble bursts, it could take several years before real estate values return to the levels they achieved at the height of the bubble.