Category Archives: Real Estate

Whence The Housing Bubble?

Editor’s Note: RealForecasts.com is re-publishing a blog post titled “Whence The Housing Bubble?”, originally posted by Joseph Salerno on Circle Bastiat on March 5, 2013.

At the end of 2012, the ratio of the average existing home sales price of $225,400 to the average household income of $71,274 equaled 3.16, less than its long-term average of 3.21. Through the first three quarters of 2013, the average existing home sales price had increased to $243,233. Average household income for 2013 is not yet available. Even if we’re conservative and assume that average household income increased by only 1.5% through the first three quarters of 2013, the ratio has increased to only 3.36, slightly greater than the long-term average but well below the level reached at the height of the Housing Bubble.

Whence The Housing Bubble?

By Joseph Salerno

March, 2013

I have recently written that there are certain key indexes and ratios derived from Austrian business cycle theory that help us discern the development of bubbles in various sectors. As Mises wrote: “Only theory, business cycle theory, permits us to detect the wavy outline of a cycle in the tangled confusion of events.”

Jeff Peshut, an institutional real estate investment manager, has been kind enough to share with me a chart that he has developed that is useful in detecting a bubble in the housing market.  His chart below shows the ratio of the average existing home sales price to average household income. The long term average (LTA) of this ratio has been slightly above 3.0. At the beginning of 2001, however, it began to rise rapidly, reaching a peak 33 percent higher than the LTA during 2005, and then declining precipitously back to its LTA during 2008.

Peshut’s chart also shows that, as of the beginning of 2012, Fed monetary policy had been unable to restart a bubble in the housing market unlike it had done in financial asset, farmland, and commodities markets. In fact housing prices were still falling both absolutely and in relation to household income. This is apparently beginning to change as it has recently been reported that the S&P/Case-Schiller Home Price Indices “showed that all three headline composites ended the year with strong gains. The national composite posted an increase of 7.3% for 2012. The 10- and 20-City Composites reported annual returns of 5.9% and 6.8% in 2012.” In contrast, national income rose by 4 percent and disposable personal income by about 2 percent year over year in 2012.

Average-Home-Price-To-Household-Income-Ratio-02-13-1

Joseph Salerno is academic vice president of the Mises Institute, professor of economics at Pace University, and editor of the Quarterly Journal of Austrian Economics. He has been interviewed in the Austrian Economics Newsletter and on Mises.org.

The Impact of Federal Reserve Policy on the Multi-family Sector

Editor’s Note: For its sixth post, RealForecasts.com is re-publishing a white paper titled “The Impact of Federal Reserve Policy on the Multi-family Sector”, which was written in March of 2010 and distributed by ING Clarion Partners to institutional investors and consultants.

Although the Fed stopped purchasing agency debt and MBS coincident with the end of QE1 in March of 2010, it resumed its purchases with the commencement of QE2 in November of 2010 and continued purchases through the end of QE2 in June of 2011. These continued purchases further bolstered multi-family lending and capital values and forestalled the risk of reversal in the multi-family property market that was raised by this paper.

The Fed’s third round of quantitative easing (QE3) began in September of 2012. Unlike QE1 and QE2, QE3 does not have a defined timeframe and will reportedly continue until the employment market improves. Combined with purchases of long-term Treasuries under “Operation Twist”, which is designed to drive down long-term interest rates, since September of 2012 the Fed has been buying $85 billion of assets per month.

The Impact of Federal Reserve Policy on the Multi-family Sector

Jeffrey J. Peshut, M. Gregory Chicota, David J. Lynn, PhD, Tim Wang, PhD, Bohdy Hedgcock

March, 2010

Executive Summary

We believe that the Federal Reserve’s explicit support for housing-related government-sponsored enterprises (GSEs) — Fannie Mae, Freddie Mac, Ginnie Mae, and the Federal Home Loan Banks – has helped avert a more severe fall in housing values. It has also helped to bolster multi-family lending and capital values. This support appears to be waning, however, as the Fed has announced an end to the programs in March. This policy shift will likely impact the availability and cost of debt for multi-family properties, which may have a spillover effect on property valuations.

Overview

In November of 2008, the Federal Reserve announced a $600 billion program to purchase the direct obligations of housing-related GSEs — Fannie Mae, Freddie Mac, and the Federal Home Loan Banks — and mortgage-backed securities (MBS) guaranteed by Fannie Mae, Freddie Mac, and Ginnie Mae. According to the Fed, the action was taken to reduce the cost and increase the availability of credit for the purchase of houses, which was expected to support housing markets and foster improved conditions in financial markets more generally.

Purchases of up to $100 billion in GSE direct obligations under the program were to be conducted with the Federal Reserve’s primary dealers through a series of competitive auctions. Purchases of up to $500 billion in MBS were to be conducted by asset managers selected via a competitive process. Purchases of both direct obligations and MBS were expected to take place over several quarters.

Purchases of up to $100 billion in GSE direct obligations under the program were to be conducted with the Federal Reserve’s primary dealers through a series of competitive auctions. Purchases of up to $500 billion in MBS were to be conducted by asset managers selected via a competitive process. Purchases of both direct obligations and MBS were expected to take place over several quarters.

In December of 2009, the Treasury Department quietly announced that instead of limiting its support to the GSEs to the previously-announced $600 billion, its support would be unlimited for the next three years.

Since the original program was announced in November of 2008, the Federal Reserve has actually purchased $152.4 billion of Federal agency debt securities and $970.3 billion of mortgage-backed securities guaranteed by Fannie Mae, Freddie Mac and Ginnie Mae. The Fed said last month it will stop buying agency debt and MBS at the end of March. By then, the Fed plans to have bought about $175 billion worth of agency debt and $1.25 trillion worth of mortgage-backed securities.

GSE Share of Residential Mortgage Loans

The GSEs hold the largest share of single-family residential mortgages and home loans, including $5.1 trillion of loans that support the mortgage-backed securities they have issued and $446.4 billion of “whole” loans in their own portfolios. Combined, they account for approximately $5.5 trillion or 51% of the almost $10.9 trillion of single-family mortgage debt outstanding in the U.S. They are followed by Commercial Banks with $2.2 trillion (20%), Asset-Backed Securities issuers with $1.6 trillion (15%), Savings Institutions with $537.4 billion (4.9%), Finance Companies with $345.1 billion (3.2%) and Credit Unions with $318.4 billion (2.9%) (Figure 1).

The GSEs also hold the largest share of multi-family mortgage loans, with $197.4 billion of “whole” loans in their own portfolios and $162.2 billion of loans that support the mortgage-backed securities they have issued. Combined, they account for $359.6 billion or 39% of the $911.7 billion of multi-family residential mortgage debt outstanding. They are followed by Commercial Banks with $217 billion (24%), Asset-Backed Security issuers with $110 billion (12%), State and Local Governments with $66 billion (7%), Savings Institutions with $64 billion (7%) and Life Insurance Companies (6%) (Figure 2).

Impact of Federal Reserve Policy - Figure 1 and 2

It is worth noting that the amount of single-family residential mortgage debt outstanding greatly exceeds the amount of multi-family residential mortgage debt outstanding, with multi-family mortgages representing only 7.7% of all residential mortgage debt outstanding. More importantly for this analysis, GSE single-family residential mortgage debt outstanding dwarfs the amount of GSE multi-family residential mortgage debt outstanding, with GSE multi-family mortgages representing only 6.5% of all GSE residential mortgage debt outstanding.

Multi-Family Debt Outstanding, Interest Rates and Equity Returns

While the Fed’s program was designed to hold down home loan costs and stimulate the economy, research suggests that it has had the ancillary effect of increasing the availability and reducing the cost of credit for the purchase of multi-family residential properties. This in turn has slowed the rate of increase in the Income Return for NCREIF’s multi-family property sector — a proxy for capitalization rates (cap rates) — compared with NCREIF’s other property sectors.

From the end of the third quarter of 2008 through the end of the third quarter of 2009, a period which encompasses the Fed’s program, GSE multi-family residential mortgage debt outstanding increased by 9.5% (Figure 3).

Impact of Federal Reserve Policy - Figure 3

During the same four quarters, all multi-family residential mortgage debt outstanding increased by only 1% and commercial mortgage debt outstanding decreased by 1%.

As the outstanding GSE multi-family residential mortgage debt increased from the end of the third quarter of 2008 through the end of the fourth quarter of 2009, the cost of that debt decreased, with the interest rate on Freddie Mac’s 5-year fixed-rate loans declining by 90 bps, from 6.4% to 5.5% (Figure 4).

Impact of Federal Reserve Policy - Figure 4

From the end of the third quarter of 2008 through the end of the third quarter of 2009, the Income Return for the NCREIF Apartment Sector increased 88 bps from an historic low of 4.45% to 5.33% (Figure 5).

Impact of Federal Reserve Policy - Figure 5

This increase is less than the 116 bps increase in the combined Income Return for NCREIF’s Office, Retail and Industrial property sectors for the same period and would seem to reflect the impact of the increased availability and reduced cost of GSE debt on the Apartment sector.

Example From A Recent Transaction

A recent transaction highlights the impact of the increased availability and the lower cost of GSE debt for the multi-family sector. City Pointe is a five-story 183-unit apartment property that is well-located in downtown Fullerton, CA.

The property is subject to a $24,000,000 Freddie Mac floating rate loan that the seller recently put in place at a spread of 311 basis points over Freddie Mac’s Reference note, which is currently at 0.1%. This results in a highly-favorable current rate of 3.21%. The loan includes a 7% interest rate cap, a 5-year term, and can be paid off with a 1% penalty at anytime after November 2010.

Widely marketed by CBRE, the offering generated 50 property tours and 27 offers. About one-third of the offers exceeded $40 million. The bidders that submitted above $40 million included REITs, private buyers and exchange buyers. The property is expected to trade for approximately $42 million, which translates into an implied going-in cap rate of 5.25% on the nominal underwriting assumptions. On more realistic assumptions, we believe the expected purchase price will represent a going-in cap rate of approximately 4.9%.

Investment Implications

The analysis presented in this paper suggests that the Federal Reserve’s program to purchase the direct obligations of housing-related GSEs has increased the amount of GSE multi-family mortgage debt outstanding, lowered the interest rates on these mortgages and slowed the increase in income returns — and decrease in value — for multi-family properties. With the Fed’s recent announcement (January 2010) that it will stop buying agency debt and MBS at the end of March, it is reasonable to conclude that we may see a moderation in the positive effects on multi-family pricing. Combined with Federal Reserve Chairman Bernanke’s statement to the Financial Services Committee (February 13, 2010) about the Fed’s strategy for winding down the extraordinary lending and monetary policies that it implemented to combat the financial crisis, there is a greater risk that recent capital market trends for the multi-family property sector could reverse.

These considerations imply that current market conditions are providing a window of opportunity for multi-family residential owners to sell assets – whether to realize gains that have accrued to them over the past several years, pay down debt or increase liquidity. Surprisingly, the NCREIF Apartment Income Return is still only 88 bps above its all-time low.

Although the current economic and real estate market environment makes finding attractive multi-family investment opportunities difficult, prospective buyers should focus on properties characterized by strong and sustainable operating fundamentals – occupancy, rental rates, income and cash flow – that will offset the potential for cap rate decompression as the Fed’s support for the GSEs wanes.

Asset Allocations Through the Recession

Editor’s Note: For its fifth post, RealForecasts.com is re-publishing a white paper titled “Asset Allocations Through the Recession”, which was written in May of 2009 and distributed by ING Clarion Partners to institutional investors and consultants. Based upon its thoughtful approach and the accuracy of its forecast and recommended strategy, I&P Real Estate selected the article for its compilation of best articles about real estate during The Great Recession.

Asset Allocations Through The Recession

Jeffrey Peshut, David Lynn, PhD and Tim Wang, PhD

May, 2009

The precipitous decline in the public-equity markets over the past year reduced total portfolio size for many institutional investors. As a result, allocations to the real estate asset class for many investors now account for a larger share of total assets, and allocations are no longer within target ranges. For example, a year ago, many institutional portfolios were at or below real estate targets of 7% to 8%; today, real estate may represent 10% to 11% of portfolios. Investment professionals often refer to this phenomenon as the “denominator effect.” This has led many investors to consider reducing their real estate portfolios in order to bring their real estate allocations back into prescribed ranges.

However, ING Clarion believes that investors should consider maintaining real estate allocations through the downturn, even if current allocations are inconsistent with strategic targets. While uncertainty is pervasive today, history reminds us that extreme market cycles in public equities and private real estate have ultimately been temporary, and we believe that the current downturn will likely follow this pattern. ING Clarion expects that public equity and private real estate markets will revert to long-term valuations (albeit, below their market peaks), thereby reversing the denominator effect and bringing actual allocations back in line with strategic targets.

During the past 30 years, declines in the S&P 500 Index (the “Index”) have typically been followed by sharp rebounds shortly after the Index reached cyclical troughs (Figure 1). For example, after experiencing significant declines from late-2000 through 2002, the Index had recovered most of its losses by the middle of 2003.

Figure 1: Total Return Among Asset Classes

Asset Allocations Through the Recession - Figure 1

Although the magnitude of the current decline has eclipsed that of 2000-2002, history suggests that the monetary policies and fiscal stimulus programs underway today should help lead to economic stabilization and an eventual recovery of the economy and the indices. In response to the slowing economy in the second half of 2000, for example, the Federal Reserve aggressively lowered its policy rate from 6.5% in December 2000 to 1.75% in December 2001.

Since August 2007, the Federal Reserve has similarly lowered its policy rate from 5.25% to effectively zero today. In addition to lowering its policy rate, the Federal Reserve has been aggressively pushing money into the banking system by purchasing Treasury securities in the open market. Forecasting a market bottom is difficult at best. However, the historical lesson is that in the past, markets have often turned quickly once reaching their nadirs. Therefore, we believe that decisions regarding strategic Asset allocation should be made with a mid-to long-term view rather than as a reaction to short-term fluctuations of individual asset classes.

For those concerned with long-term economic returns, we believe that the case for maintaining consistent allocation to real estate may actually be stronger. Private real estate generated the highest total returns on a risk-adjusted basis among the major asset classes over the last three decades (Figure 2).

Figure 2: Total Return and Volatility

Asset Allocations Through the Recession - Figure 2

Private-market real estate has also generated the second-highest average earnings yield among the four major asset classes over the past 30 years and the highest earnings yield on a risk-adjusted basis (Figure 3).

Figure 3: Yields and Volatility

Asset Allocations Through the Recession - Figure 3

Although the current NCREIF income return is near a cyclical low, ING Clarion believes that it is likely to revert to trend in the mid-term and that yields from private-market real estate will maintain their strong relative position over the long haul, especially on a risk-adjusted basis. (Figure 4)

Figure 4: Income Yields Among Asset Classes

Asset Allocations Trough the Recession - Figure 4

Private real estate has also shown low or negative correlations with equities and bonds, which provides powerful diversification benefits in a mixed-asset portfolio (Figure 5).

Figure 5: Correlations of NCREIF Property Index with S&P 500 and Barclays Capital Aggregate Bond Index

Asset Allocations Through the Recession - Figure 5

Note that prior to the current decline, private-market real estate had reported negative returns only once during the past 30 years (Figure 1). Similar to declines in the public equities markets, real estate’s decline was followed by a significant rebound. After posting negative returns from mid-1991 to mid-1993, the NCREIF Property Index recovered most of its losses by the end of 1994.

In addition to potentially superior risk-adjusted returns and diversification, we believe that private market real estate can also be viewed as a valuable hedge against the ravages of price inflation. Many economists believe that once the credit markets, equity markets and economic activity recover, the massive monetary pumping and unprecedented fiscal stimulus programs currently underway will re-ignite the flames of inflation. If these forecasts prove correct, we believe that the case for maintaining real estate allocations through the downturn becomes even more compelling.

Never Quit in the Middle of a Dip

Editor’s Note: For its fourth post, RealForecasts.com is re-publishing a white paper titled “Never Quit in the Middle of a Dip”, which was written in February of 2009. Whether you were in a Trap, on a Cliff or in a Dip during the last downturn — and whether you stuck or quit — this post can still help you to better prepare yourself for the inevitable next downturn.

Never Quit in the Middle of a Dip

Jeffrey J. Peshut

February, 2009

As the current real estate downturn continues, many real estate investors will feel pressure to divest themselves of their existing properties and portfolios — and even of the real estate asset class as a whole — to avoid further losses and pursue alternative investments that they perceive will provide superior risk-adjusted returns in the future. This pressure is sure to intensify the longer the real estate downturn lasts and will likely reach its peak at about the same time as the real estate market reaches its cyclical trough. This could lead many investors to sell at precisely the wrong time, locking in significant capital losses from which they may never recover.

This article suggests that real estate investors should never quit in the middle of a downturn or “dip”. Instead, they should ignore sunk costs, evaluate their investments prospectively and stick with the investment until the market recovers and they are once again in a position to enjoy the returns that investing in real estate is expected to provide over time.

When to Quit and When to Stick

Three curves help to both illustrate the types of situations that lead people to quit and explain why it is important to quit in some situations but stick it out in others. These three curves are “The Trap”, “The Cliff” and “The Dip”.

The Trap: “The Trap” describes situations in which we keep investing time, effort – and money – but nothing changes very much. Despite our best efforts, the situation doesn’t get much better and it doesn’t get much worse. It looks something like this:

The Trap

An example of The Trap in real estate investing is a property at which the increases in operating expenses and capital expenditures absorb most of the growth in rental rates. As a result, there is little if any capital appreciation at the property. Under a worse-case scenario, increases in operating expenses and capital expenditures exceed the growth in rental rates and the value of the property declines over time. Some have even referred to this type of property as a “value trap”.

The key to dealing with The Trap is first to recognize that we’re in one and then to get out of it as quickly as is reasonably possible. The opportunity cost of sticking with a situation that is unlikely to get better is too high.

The Cliff: “The Cliff” describes situations that involve a high degree of risk and a high cost of failure. At first, we get the results we want. Then, before we recognize it, we find ourselves staring into the abyss, with limited options to quit. As its name implies, it looks something like this:

The Cliff

An example of The Cliff in real estate investing is a highly-leveraged property or portfolio that faces some type of default situation – whether a payment default, technical default (e.g., breach of a DSCR covenant) or term default. The default situation leads to either a forced sale at discounted pricing, a deed-in-lieu of foreclosure or a foreclosure. The ultimate result is a loss of most — and usually all — of the invested capital.

The key to dealing with The Cliff is similar to the key to dealing with The Trap – we need to recognize that we’re headed for one and – if it’s not too late – quit as quickly as is reasonably possible. Of course, the potential cost of staying on The Cliff is much greater than staying in The Trap. The potential cost of staying in The Trap is losing other opportunities. The potential cost of staying on The Cliff is losing our entire investment.

The Dip: “The Dip” describes situations in which our initial investment of time, energy and money provides the results we were expecting – often quickly and easily. Then, after a time, the expected results begin to wane. For those willing and able to push a little bit longer and a little bit harder than the rest, however, we not only find ourselves achieving the results we first expected, but extraordinary results well beyond that. (Extraordinary results also accrue to those who quit early and refocus their time and effort elsewhere, but that’s a separate topic for a separate discussion.)

Almost every situation in which it is worth investing our time, effort and money is illustrated by “The Dip”. We experience The Dip in school, in sports, in our relationships, in our careers and in our investing. See The Dip (New York: Penguin Group (USA) Inc., 2007). It looks something like this:

The Dip

The Dip is so prevalent because most of the competitive systems we encounter are set up to encourage the many people who start to quit for the benefit of the few that stick it out. These systems are set up to “shake out the weak hands”. Quitting creates scarcity and scarcity creates value for the few that stick it out.

In effect, The Dip and these competitive systems are based upon various types of pyramid structures. As the Bernie Madoff situation reminds us, a pyramid structure is often a scam in which many people at the bottom support a few at the top. But a pyramid structure is not always a scam. In fact, we encounter it a lot more often than we realize.

For example, most private clubs are based upon a type of pyramid structure. Many people sign up for health clubs but very few use the club frequently after they join. This allows the operator to build a smaller facility and keep rates reasonable. The many members who join, but quit using it, support the few who join and do.

Similarly, NetFlix allows its customers to rent an unlimited number of DVDs each month for $8.99 per month, which includes postage. If someone watched a movie the day it came in and sent it right back, they’d get to watch at least six movies each month. Of course, for every customer that watches six, there are many more people who watch one movie — or even no movies — each month. Again, the many members who join but quit using it support the few who join and continue to use it.

Investment markets are also based upon a type of pyramid structure. Those who sell or quit during The Dip support those who invest during The Dip by providing them with the opportunity to enter the market at discounted pricing. The many who invest late in a market cycle also support the few who invested during The Dip by driving up values. Not surprisingly, these late-cycle investors are often some of the same investors who sold during the previous Dip. The investment market pyramid structure looks like this:

Stages of Cycle

An example of where we often see The Dip occur in real estate investing is a high-quality property in a prominent location in a first-tier submarket of a first-tier MSA — owned free and clear by a well-capitalized owner — that experiences a downturn in its local real estate market or the loss of a major tenant. Often, the two events occur simultaneously. As a result, the property’s cash flow and value decline. Depending upon the magnitude of the market downturn, it may take significant time, effort and money for the owner to work through The Dip. Ultimately, however, the market and property recover and the property’s cash flow and value begin to increase at an increasing rate, quickly exceeding the highest levels set prior to the downturn.

Having already discussed The Trap and The Cliff, it’s not too difficult to see how those of us experiencing The Dip might be fooled into believing that we are instead experiencing one of the situations that will ultimately lead to failure and, therefore, will feel pressure to give up or quit. Of course, the key to dealing with The Dip is being able to distinguish it from The Trap and The Cliff and then being able to stick with the situation long enough to get through it. If, however, we make the mistake of selling during The Dip, we will lock in our losses and provide the entry point at discounted pricing for one of the next market cycle’s “early” investors.

So it’s really very simple. Quit The Traps and The Cliffs and stick with The Dips. The hard part is distinguishing among the three and having the mental toughness to quit the first two and stick with the third.

Trap, Cliff or Dip?

Several key questions can help us to distinguish The Dip from The Trap or The Cliff:

  • What are the long-term population and job growth prospects for this MSA and Submarket? Has the market recovered from similar downturns in the past?
  • What is the property’s position within its submarket and competitive set? Is its market position improving or deteriorating? Are there steps we can take to maintain or improve it?
  • Do we own the property free and clear or is it subject to debt financing? If subject to debt financing, can we forecast a scenario that will lead to a payment, technical or term default?
  • Do we have the capital resources necessary to fund capital expenditures or to restructure the capital stack to head off a potential default?

The better the MSA, the Submarket, the property’s market position and our capital resources, the more likely we are experiencing The Dip and not The Trap or The Cliff.

Sticking With The Dip

It’s human nature to quit when it hurts. Short-term pain has more of an impact on the average person than long-term gains do. The key to sticking with an investment through The Dip is to rise above the short-term pain and stay focused on the long-term gain when others are losing sight of it. We should never quit something with great long-term potential just because we’re having difficulty coping with the discomfort of the moment.

It’s also important to recognize that it’s the difficult challenges – The Dips – that provide us with opportunities to pull ahead of our competitors. In a competitive market environment, adversity is actually our ally. The harder it gets, the better our chances of differentiating ourselves from the competition. If adversity causes us to sell or quit an investment in the middle of The Dip, we’ve not only squandered a great opportunity, we’ve likely passed that opportunity along to one of our competitors.

One technique that will help us to stick with an investment through The Dip is to write down in advance the circumstances under which we will quit — and when. We should then stick with the investment unless these circumstances come to pass. Developing an exit strategy as part of our initial underwriting process will provide us with invaluable perspective if we find ourselves in a painful situation, frustrated or stuck.

Summary

We’ve seen that sticking with The Dip leads to extraordinary results, whereas sticking with The Trap or The Cliff leads to failure. In the case of The Cliff, that failure can be catastrophic. We’ve also discussed ways to recognize whether we’re in The Dip or The Trap, or on The Cliff, and to overcome short-term pain to realize long-term gains by quitting The Traps and The Cliffs and sticking with The Dips. In other words, as the title of this article correctly states, we should never quit in the middle of a Dip.

“Deep Survival” In Real Estate Investment Management – How To Survive (and Even Thrive) in 2009

Editor’s Note: For its third post, RealForecasts.com is re-publishing a white paper titled “‘Deep Survival’ In Real Estate Investment Management – How To Survive (and Even Thrive) in 2009”, which was written in January of 2009. The advice applies to challenging situations today as much as it applied to the challenging market conditions we were going through almost five years ago.

“Deep Survival” In Real Estate Investment Management – How To Survive (and Even Thrive) in 2009

By Jeffrey J. Peshut

January, 2009

In his book Deep Survival: Who Lives, Who Dies and Why (New York: W.W. Norton & Company, 2003), Laurance Gonzales alternates compelling storytelling with first-rate scientific research to describe the art and science of survival. Although aimed primarily at wilderness travelers and extreme sports enthusiasts, Deep Survival is also a useful guide for anyone facing one of life’s great challenges.

Gonzales divides his book into two parts. In the first part, titled How Accidents Happen, Gonzales provides examples of people who got into trouble and how they got there. In the second part, titled Survival, he explores the character traits and behaviors of those that survived life-threatening situations.

The real estate investment management business is not a life or death environment. But the downturn in the economy is presenting challenges to our firm and our competitors that will undoubtedly change the landscape in our industry.  Gonzales’ lessons provide a roadmap to not only survive, but also maximize opportunities during the downturn.

According to Gonzales, here is what survivors do (with suggestions about ways to apply these practices to the current business environment in italics):

1. Perceive and Believe: Even in the initial crisis, survivors’ perceptions and thought processes keep working. They notice the details. If they experience any denial, it is counterbalanced by strong confidence in the information provided by their five senses. They immediately begin to recognize, acknowledge and even accept the reality of their situation.

In the sport of orienteering, competitors have to navigate across unfamiliar terrain using a detailed map. If they ever start saying to themselves, “Well, that lake could have dried up,” or “That mountain could have moved,” they are doing what orienteers call “bending the map”. They are denying the reality before them and substituting the world they would rather see.

During 2009, we need to avoid “bending the map” and accept that market occupancy and market lease rates will decrease. We need to be prepared to meet the market when negotiating with both existing and prospective tenants.

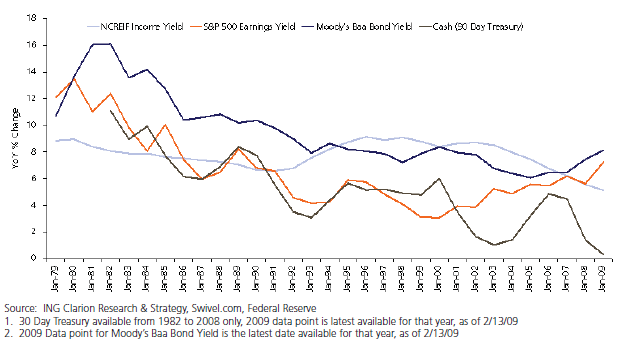
Similarly, we need to accept that required rates of return will continue to increase and property values will continue to decrease, especially for properties with higher risk profiles. If we do not have to sell, we need to prepare ourselves and our clients to hold their investments through the dip. If we have to sell, it will be best to do so sooner rather than later. Conversely, unless there is a very compelling opportunity, investors with capital should keep their powder dry and wait for the market to find a bottom before making new investments.

2. Stay Calm: In the initial crisis, survivors make use of fear and avoid being ruled by it. Their fear often feels like and is turned into anger, which motivates them and makes them sharper. They understand at a deep level the need to stay calm and are on constant guard against giving in to their emotions. They use humor to keep the situation in perspective. Those who can learn to think clearly and make good decisions under stress or in high emotional states are more likely to survive.

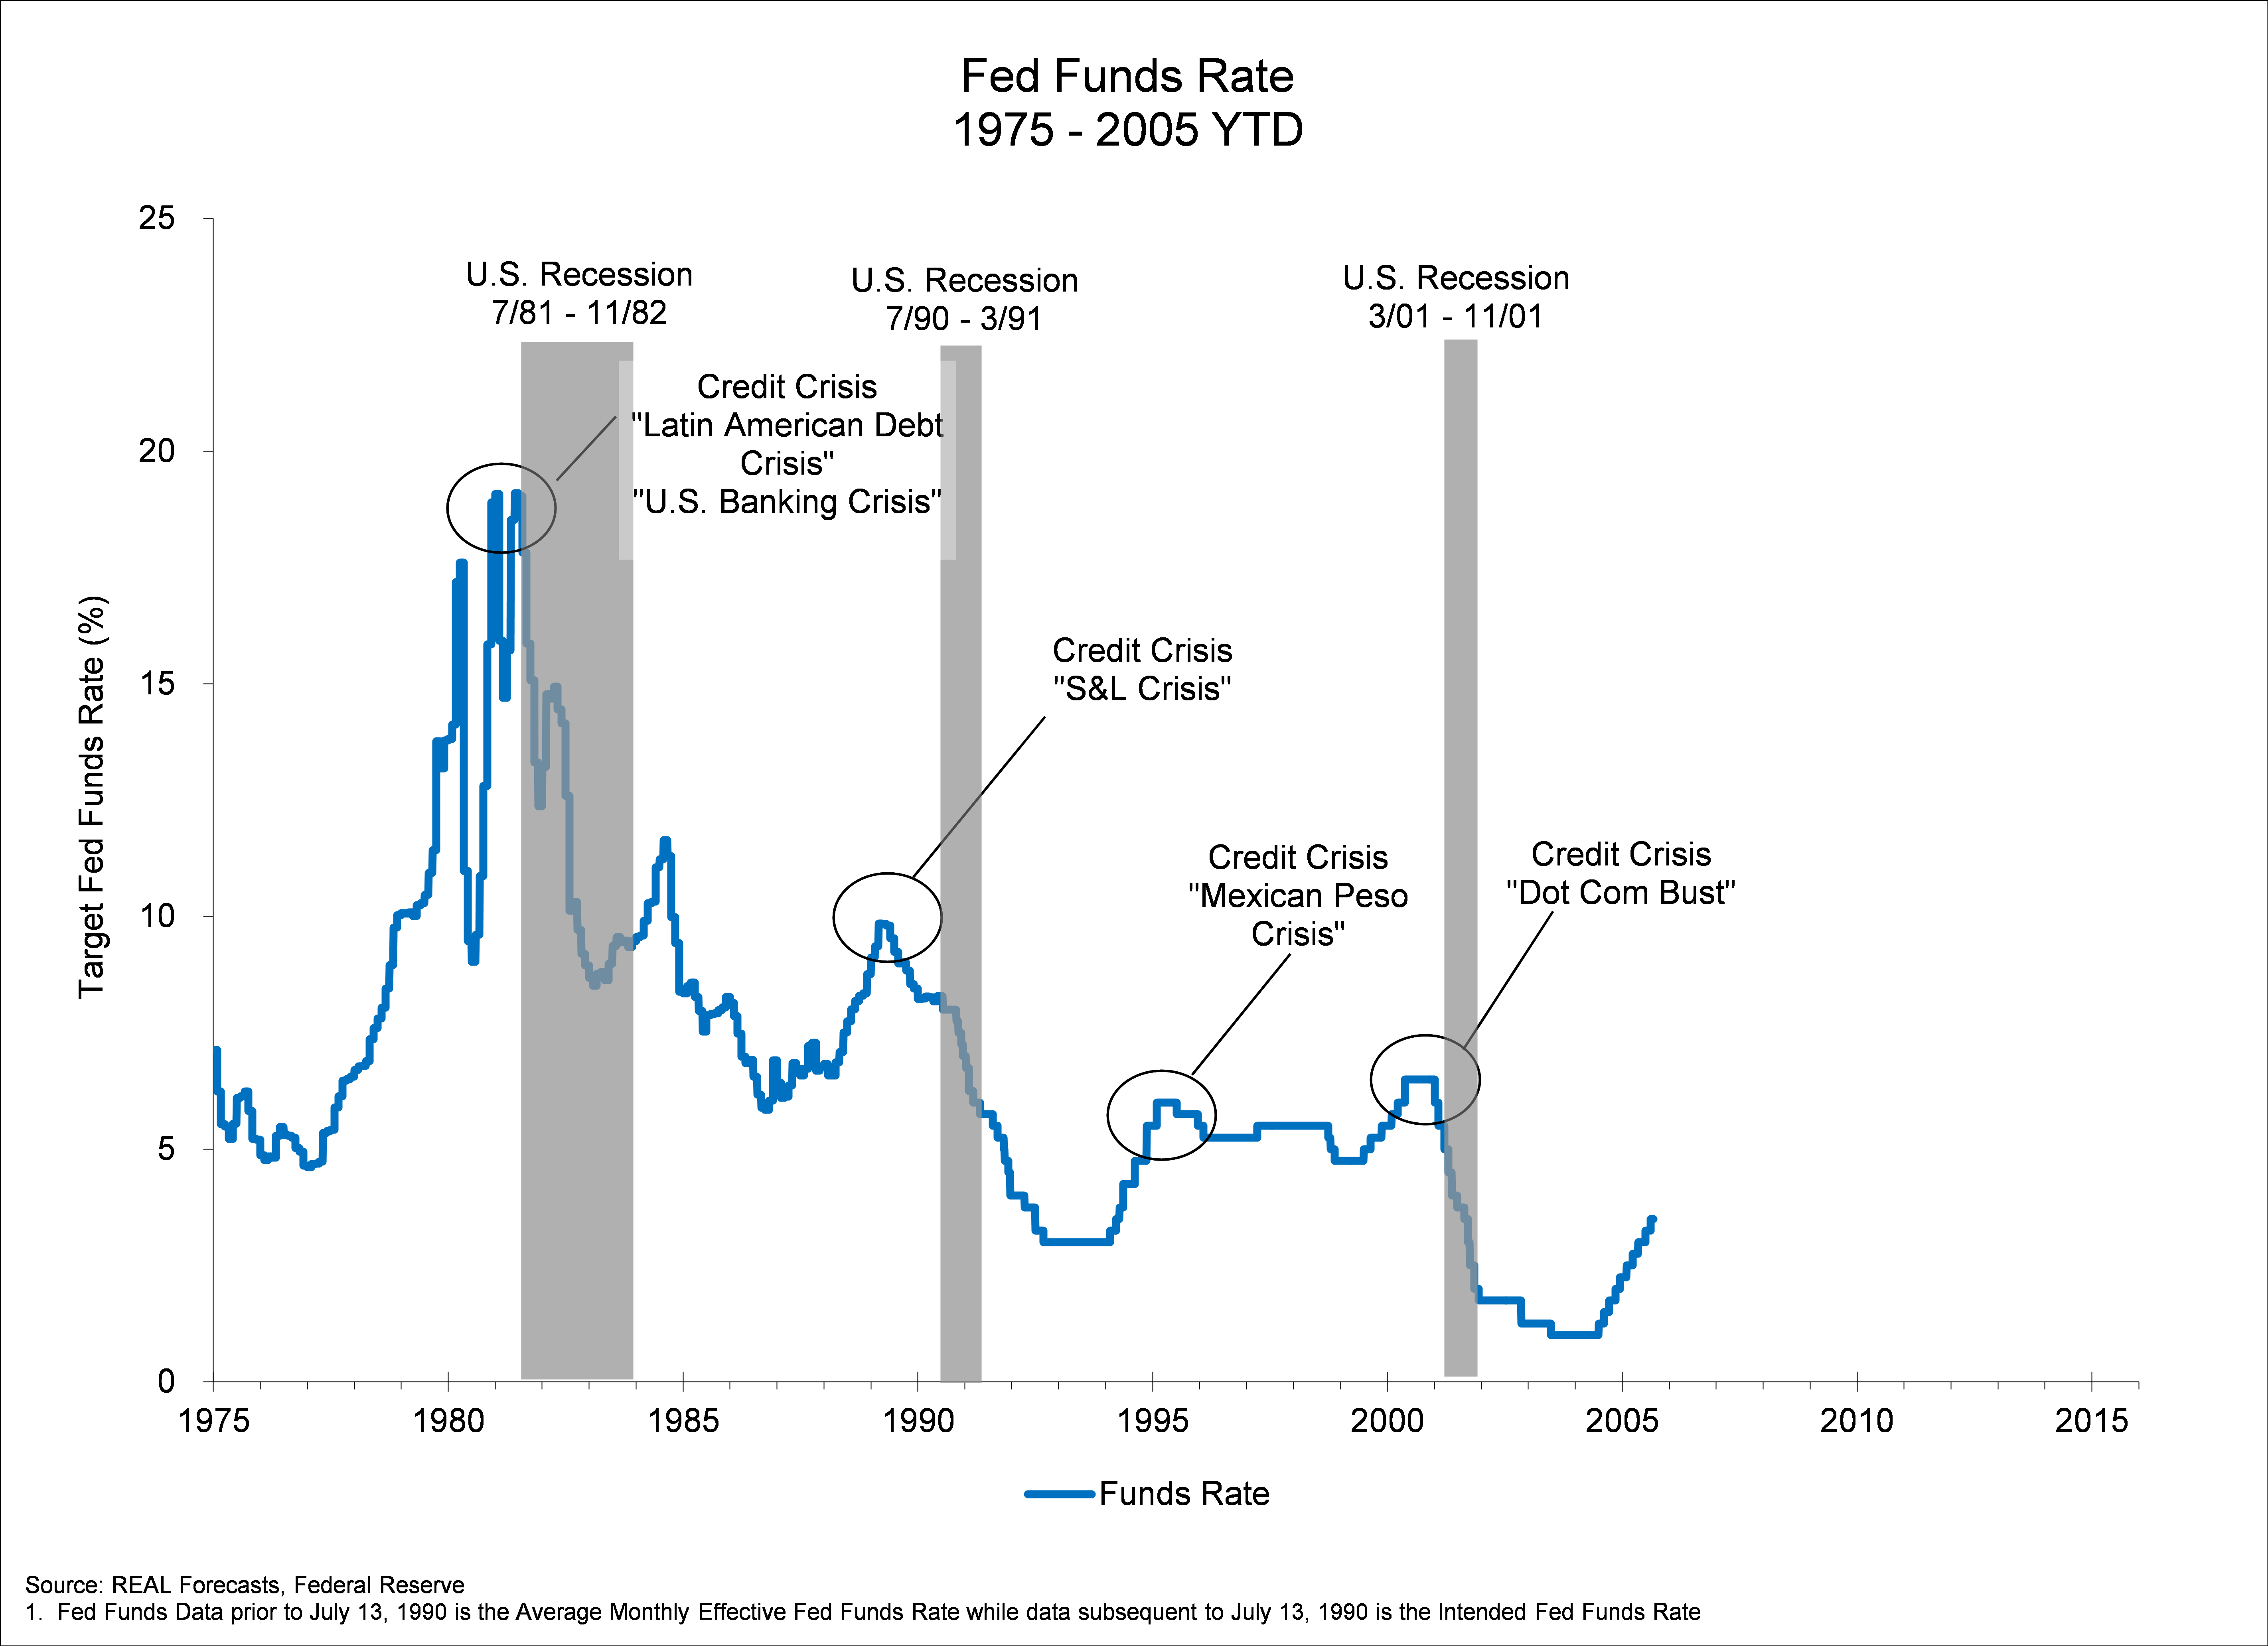
Market conditions will likely get worse before they get better. We need to remain calm and remind ourselves that conditions will eventually improve. They always have. They will again. In the meantime, we need to stay focused on maximizing property performance and strengthening our relationships.

3. Think/Analyze/Plan: Survivors quickly organize, set up routines and institute discipline. They push away thoughts that their situation is hopeless. A rational voice emerges and is often actually heard, which then takes control of the situation. Survivors describe this experience as a feeling of “splitting” into two people and then “obeying” the rational one. It begins with the paradox of seeing the stark reality but acting with the expectation of success.

We need to be realistic about the difficulty of the market conditions we expect to encounter during 2009 and 2010, but optimistic about our ability to succeed in the face of these conditions. That is very different from simply being optimistic about expected conditions.

4. Take Correct, Decisive Action: Survivors are able to transform thought into action. They are willing to take risks to save themselves and others. They are able to break down very large jobs into small manageable tasks. They set attainable goals and develop short-term plans to reach them. They are meticulous about doing those tasks well. They deal with what is within their power from moment to moment, hour to hour and day to day. They leave the rest behind.

Although we cannot do anything about the increasing rates of return and the decreasing lease rates we will encounter in the coming year, we can take steps to maintain and build our relationships with our clients. We can also take steps to maintain and build the occupancy of our properties and portfolios. And rather than waiting for one large tenant to lease a large block of vacant space, we need to be prepared to break it up into smaller increments to attract smaller tenants – which are typically more prevalent in the market.

5. Celebrate Successes: Survivors take great joy from even their smallest successes. That is an important step in creating an on-going feeling of motivation and preventing a descent into hopelessness. It also provides relief from the suffocating stress of a true survival situation.

Most inexperienced mountain climbers make the mistake of celebrating on the summit, even though the hardest part of the trip is still before them — getting back down. Experienced climbers know that most accidents happen on the way down, when they are tired and more likely to drop their guard. Companies and even individual careers are subject to the same rules: We are most vulnerable at the top of the market and at those times when we feel most secure and confident. Like inexperienced mountain climbers, most companies do not plan for the trip back down.

During 2009, we need to take time to celebrate our successes, no matter how small.

6. Count Their Blessings: This is how survivors become rescuers instead of victims. There is always someone else they are helping more than themselves, even if that someone else is not present.

As Steve Furnary said in his year-end message, we have much for which to be thankful. We have a great company, made up of great people and excellent relationships with over 250 clients. We have also reported great returns over the past several years, which will continue to show up in our reported returns going forward.

7. Believe That They Will Succeed: All of the practices just described lead to this point. Survivors consolidate their personalities and fix their determination. Survivors admonish themselves to make no more mistakes, to be very careful and to do their very best. They become convinced that they will prevail if they do these things.

Down markets provide an opportunity for great companies to distinguish themselves from their competitors and actually increase their market share. To paraphrase Warren Buffet, no one can tell who is swimming naked until the tide goes out. We are already capitalizing on this opportunity as we take over properties and portfolios from competitors such as Morgan Stanley and RREEF. Somebody is going to come out on top during this next phase of the market cycle. It might as well be us.

8. Surrender: This sort of thinking has been called “resignation without giving up” or “survival by surrender.” A climber recognizes that he will probably die, doesn’t let it bother him and goes ahead and crawls off the mountain anyway. Survivors also manage pain well. One woman, who walked out of the Sierra Nevada Mountains after surviving a plane crash, wrote that she “stored away the information” that her arm was broken.

It will be painful as our values continue to decline during 2009. We will have to make some difficult decisions – accepting lower than pro forma rents, leasing to higher risk tenants, even selling at a loss. We need to “put away” that pain and focus on the things we can control, including our relationships with our clients, with our tenants and among ourselves. The short-term pain will pay off when we are able to enjoy the long-term rewards.

9. Do Whatever is Necessary: Survivors have “meta-knowledge” – loosely defined as “knowledge about knowledge.” They know what they know and they know what they do not know. In particular, they know their abilities and do not over or under estimate them. That said, they still believe that anything is possible and act accordingly. Play leads to invention, which leads to trying something that might have seemed impossible.

Survivors do not expect or even hope to be rescued. They are coldly rational about using the world, obtaining what they need and doing what they have to do.

It will not do us any good to wait around for the Fed, the White House or Congress to rescue us from our current situation. We need to take responsibility for our own attitudes and our own actions and do what we have to do for our clients, our company and ourselves.

10.Never Give Up: Survivors are not easily frustrated. They are not discouraged by setbacks. They accept that their environment is constantly changing. There is always one more thing that they can do. They pick themselves up and start the entire process over again, breaking it down into manageable bits.

Survivors always have a clear reason for going on. They keep their spirits up by developing an alternate world made up of rich memories to which they can escape. They then mine those memories for whatever will keep them occupied. They come to embrace the world in which they find themselves and see opportunity in adversity.

In the aftermath, survivors learn from and are grateful for the experiences they have had.

Winston Churchill may have said it best, “Never, never, never give up.”

In Deep Survival, the wilderness is a metaphor for all of life’s challenges. And the survivors of these challenges have universal lessons to teach us all – even those of us traveling through the wilderness of real estate investment management during 2009.

Is There A Real Estate Bubble?

Editor’s Note: This is the second post for RealForecasts.com. For its second post, RealForecasts.com is re-publishing a white paper titled “Is There a Real Estate Bubble?”, which was written in September of 2005. Not only were there were bubbles in both the residential and commercial real estate capital markets, but the bursting of these bubbles that began in August of 2007 precipitated the greatest economic downturn in the U.S. since The Great Depression of the 1930s.

Is There a Real Estate Bubble?

By Jeffrey J. Peshut

September, 2005

The question on the minds of most real estate investors today is whether there is a “bubble” in the real estate capital markets and, if so, when will it “burst”. I wrote the [previous post titled “Will Market’s Boom/Bust Cycle Repeat?”] in mid-1998. The question then was whether there was a bubble in the stock markets and economy and, therefore, the real estate space markets. Hindsight tells us that there was in fact a bubble in all three, as these bubbles burst about 18 months later.

Is There A Bubble?

Those who argue that there are bubbles in both the residential and commercial real estate capital markets today make the following case:

– We are once again nearing the end of a “credit-fueled” bubble similar to the credit-fueled bubbles that ended during the late 1980’s and late 1990’s.

– The Federal Reserve and commercial banks cause these bubbles by artificially expanding the supply of money and credit. The Fed expands the supply of money and credit by buying Treasury Bills in the open market or by lowering the discount rate as a means of lowering short-term interest rates. This expansion of the money base is magnified by the impact of fractional-reserve banking.

– When the Fed pumps money into the economy, interest rates drop — at least at first.

– As the commercial banks’ reserves increase and interest rates decrease, businesses take out bank loans to invest in projects that weren’t profitable at the higher interest rates previously set by the free market. As businesses hire workers and buy equipment and raw materials to implement their investment plans, the economy picks up and the boom phase of the cycle begins.

– The boom, however, is founded upon an illusion. The government appeared to enlarge the pool of savings available for businesses to invest, but in reality it created money that didn’t exist before. It’s this money that was created “out of thin air” that creates the bubble.

– After all, the government can’t create wealth or real savings. It can only confiscate and redistribute existing wealth through taxation or inflation. When the Fed reduces interest rates by inflating the money supply, it in effect confiscates part of our wealth by inflation and lends our money to borrowers at the below-market rates referenced above.

– This subsidized interest rate sends a false signal to businesses, encouraging them to invest in projects that consumers weren’t in fact willing to pay for.

– Alas, all credit-fueled bubbles must end. Otherwise, we risk hyper-inflation or a collapse in the value of the dollar relative to other currencies.

– To end the bubble, the Fed must reverse its earlier policy and contract the supply of money and credit.

– During the late 1980’s, concerns about the rate of inflation for goods and services and a weak dollar lead the Federal Reserve to drastically tighten credit and end the bubble. During the late 1990’s, “irrational exuberance” in the stock market led the Fed to tighten credit and end that bubble. Today, concerns about a “housing bubble” and a weak dollar seem to be the impetus behind the Fed’s increasingly tight monetary policy.

– When credit-fueled bubbles end, they burst. And when they burst, the ill-advised investments that businesses made during the period of the Fed’s loose monetary policy are exposed.

According to this line of thinking, the question of whether the “bubble” in the real estate capital markets will “burst” becomes not “if” but “when”. And once it does, by “how much” will values decline.

If So, When Will It Burst?

To attempt to answer the “when” question, I offer the following observations:

– During the last “credit-fueled” bubble, the rate of growth in the money supply reached its peak in mid-1998 and its trough in late-2000. This correlates closely with the Fed’s “loose” monetary policy from early-1995 through early-1999 and its “tight” monetary stance from early-1999 through late-2000. See the following [Fed Funds Rate and REAL Money Supply (RMS) graphs. See also “The Mystery of the Money Supply Definition” by Frank Shostak (The Quarterly Journal of Austrian Economics Vol. 3, NO. 4 (Winter 2000): 69–76.) REAL Money Supply represents the true definition of the money supply outlined in Dr. Shostak’s article.]

Fed Funds Rate 1975 - 2005

REAL Money Supply 1975-2005

– During what is arguably the most recent “credit-fueled” bubble, the rate of growth in the money supply reached a peak in early-2002 and again in early-2004, before beginning its current descent. Again, this correlates closely with the Fed’s loose monetary policy from late-2000 through early-2004 and its tight monetary stance since early-2004. It also correlates closely with the most recent run-up in prices in the residential and commercial real estate capital markets.

– Recently, [RMS has] been increasing at a decreasing rate. “Real [RMS]” ([RMS] adjusted for price inflation) correlates closely with changes in Industrial Production – a key measure of economic activity — with a 12-month lag. “Adjusted [RMS]” ([RMS] adjusted for price inflation and economic activity) correlates closely with changes in the stock markets, with a 4-month lag.

If past is prologue, the effect of the Fed’s current tight monetary stance on the money supply’s growth rate creates a significantly heightened risk of a slowdown in economic activity, a correction in the stock markets and a correction in the real estate capital markets in the year ahead.

How Much Will Values Decline?

With respect to the question of “how much” values will decline, the following observations are noteworthy:

– From 1995 through 2004, the spread between going-in cap rates and the 10-year Treasury averaged 320 bps.

– A year ago, going-in cap rates and 10-year unlevered IRR’s were 7.0% to 7.5% and 8.25% to 8.75%, respectively. These going-in cap rates represented a spread of approximately 280 to 330 bps over the 10-year Treasury, consistent with the historical average.

– Today, going-in cap rates and 10-year unlevered IRR’s are 5.75% to 6.25% and 7.0% to 7.25%, respectively, for “core” real estate investments. The going-in-cap rate represents a spread of approximately 155 to 205 bps to today’s 10-year Treasury.

– This spread is not only narrow for cap rates, but would also be narrow for commercial mortgage spreads. From 1996 through year-to-date 2005, the spread between commercial mortgages and the 10-year Treasury averaged 190 bps.

– According to L.J. Melody, today’s rates for fixed-rate commercial mortgages are 4.9 % to 5.5% for the four major property types. These rates represent a spread of 70 to 130 bps over the 10-year Treasury, approximately half the historical average.

– Therefore, it appears that last year’s cap rate levels were sustainable based upon historical averages but that the 125 bps decline in cap rates and IRR’s during 2005 will prove to be unsustainable.

– For a property with NOI of $5 million, a 125 bps increase in today’s going-in cap rates would result in a decline in value of 17% to 18%. It is important to note that this decline in value reflects only a return of the going-in cap rate spread to its historical average. It does not reflect a change in the 10-year Treasury rate.

– It is also important to note that a 17% to 18% decline in value requires a 20% to 22% increase in value to return to the value that existed before the decline.

One final observation: Once bubbles burst and market values decline, market values typically take a long time to recover. For example, five years after the bubbles in the stock markets burst, the Dow Jones Industrial Average is still only 90% of the all-time high it set in early-2000. Similarly, the S&P 500 Index and the NASDAQ Composite Index are only 80% and 45%, respectively, of their 2000 all-time highs. Therefore, once the real estate bubble bursts, it could take several years before real estate values return to the levels they achieved at the height of the bubble.

Will Market’s Boom/Bust Cycle Repeat?

Editor’s Note: This is the inaugural post for RealForecasts.com. For its first post, RealForecasts.com is re-publishing an article titled “Will Market’s Boom/Bust Cycle Repeat?”, which appeared in the June 17-June 30, 1998 edition of the Colorado Real Estate Journal. Today, we know the answer to the question posed by the article. The market’s boom/bust cycle did repeat — a mere 18 months later.

Will Market’s Boom/Bust Cycle Repeat?

By Jeffrey J. Peshut

June, 1998

Contrary to recent media reports, the pending sale of Miller Global Holdings’ eight-building metro Denver office building portfolio to Chicago-based Equity Office Properties LLC for $394 million will not be the largest commercial real estate transaction in Colorado history. That honor goes to a transaction completed in the early-1980s by Miller, Klutznick, Davis and Gray, another Miller-led organization.

Denver real estate veterans will recall that MKDG sold the 3-million square foot City Center complex to Prudential’s “PRISA” fund for $500 million in 1983-1984. Completed at the apex of an unprecedented economic and real estate boom, the sale included buildings known today as Johns Manville Plaza (f/k/a Petro Lewis Tower), MCI Tower (f/k/a ARCO Tower), First Interstate Tower North, 1801 California Street (f/k/a City Center IV) and the 615-room Marriott Hotel.

Within less than two years of MKDG’s sale to Prudential, however, Denver’s economy and real estate market descended into one of the worst bust cycle’s in the city’s history.

The question for market watchers today is whether Miller Global Holdings’ sale to Equity Office Properties signals the top of this market cycle or whether the sale is the harbinger of a “new era” that is immune from the boom/bust cycles that have plagued the Denver economy and real estate market in the past.

A New Era

Those who believe we are entering a new era — where the old rules no longer apply — advance a number of arguments in favor of their view.

With respect to the national economy, they argue that the break up of the Soviet Union and the end of the Cold War freed up investment capital for productive uses, instead of being frozen in non-productive military uses. They say that this new capital has, in turn, been leveraged by advances in computer technology, creating unprecedented increases in productivity, low unemployment and low inflation.

Nowhere is this more apparent than in Colorado. Today, the state’s unemployment hovers just above 3 percent, with moderate inflation of only 3.4 percent.

Further, most business leaders believe that the state’s over-reliance on the energy industry caused the deep recession of the late 1980s. These leaders now point to a more diverse economy as the primary reason why a sharp economic downturn will not recur.

Real estate pundits also argue that the massive overbuilding of the 1980s was caused by a combination of the savings and loans — and other financial institutions — eager to make loans and passive tax laws that offered developers incentives for building. They point out that neither condition exists today.

They say that even though 1997 saw a sharp increase in the amount of speculative construction in both the office and industrial categories, it pales in comparison to the amount of build-to-suit construction. Industry insiders also argue that the emphasis on “modular” low-rise and mid-rise developments — as opposed to the high-rise developments of the 1980s — will help ensure that the supply of speculative office space will not significantly outpace tenant demand.

Sign of a Market Top

Those who view the Miller Global/Equity Office transaction as the sign of a market top argue that we are once again nearing the end of a “credit-fueled” economic expansion, similar to the credit-fueled expansion that ended during the mid-to-late 1980s. They believe that the Federal Reserve and commercial banks cause unending boom/bust cycles by artificially expanding — and later contracting — the supply of money and credit.

The Federal Reserve expands the supply of money and credit either by buying Treasury Bills in the open market or by lowering the discount rate as a means of lowering short-term interest rates.

As short-term interest rates fall, commercial banks tend to make more loans to both businesses and consumers. And when banks make more loans, they essentially create money that didn’t exist before. As businesses and consumers spend this borrowed money, the economy expands.

This scenario describes what occurred in the U.S. economy during the early-to-mid 1980s. Many argue that this also describes what happened in the U.S. economy during the past several years.

As with all good things, however, economic expansions too must come to an end. Like a fire, they either burn themselves out from lack of fuel or are put out by the Fed before the rage out of control.

During the mid-to-late 1980s, concerns about the rate of inflation for goods and services, and a weak dollar, led the Fed to drastically tighten credit and thus “put out” that economic expansion. It is too soon to tell whether concerns about the rate of inflation — for goods, services or financial assets — will lead the Fed to put out this expansion. Or whether the Fed will allow this expansion to “burn out” on its own.

Irrespective of how it will end, proponents of this view argue that the volume and profile of investment capital flowing into Denver real estate suggests that the current economic expansion and real estate boom will end in the near-to-mid term, especially if they look at how real estate marketing software can help to get agencies and realtors back on their feet. And what better way than to market yourselves to potential clients, buyers, and sellers. In the meantime though, consider the following points:

  • Money Supply. First, in most business cycles, the growth in money accelerates as the business cycle matures. An accelerating growth in the money supply certainly explains the accelerating flow of investment capital into Denver real estate.
  • David and Goliath. Further, despite outward appearances to the contrary, hordes of small “retail” investors are replacing a handful of “high net worth” investors as owners of a preponderance of Denver’s investment grade commercial real estate. Often, the arrival of the “little guy” signals the arrival of a market top.

This brings us back to the potential significance of the Miller Global/Equity Office sale. Just as Prudential’s “PRISA” fund acquired City Center from MKDG on behalf of the small pension fund investor in 1983-1984, Equity Office Properties is acquiring Miller Global Holdings’ portfolio on behalf of the small REIT investor in 1998. While the investment vehicle may be different, the profile of the ultimate investor remains the same.

Conclusion

It is human nature to forecast or project into the future in a linear fashion. Unfortunately, it is this propensity to project “linearly” that causes markets to behave “cyclically”.

Thus, the question of whether the boom/bust cycle will repeat becomes not “if?” but “when?” And once it does, for “how long?”