
By Jeffrey J. Peshut
March 20, 2014
On January 24, the National Council of Real Estate Investment Fiduciaries (NCREIF) released results for the NCREIF Property Index (NPI) for the fourth quarter of 2013. The NPI reported a Total Return for the quarter of 2.53%, comprised of a 1.34% Income Return and a 1.19% capital Appreciation Return. For the year, the NPI returned 10.98%, which included an Income Return of 5.61% and an Appreciation Return of 5.16%. A potential real estate investor may want to see how they too can make a profit this way and add to their real estate portfolio. There are many potential ways that this can be done, however, nowadays this can be achieved by looking to invest in real estate using EFT’s (in Immobilien mit ETFs investieren) which goes to show how the digital market has had an effect on the sector.
NCREIF is an association of professionals involved with private-market real estate equity investments owned by pension funds, who come together to promote research on the asset class and address important industry issues. www.NCREIF.org The NPI consists of a portfolio of 7,029 investment-grade, income-producing apartment, office, retail, industrial and hotel properties with a year-end market value of approximately $354 billion. The NPI includes property data from over 195 Metropolitan Statistical Areas (MSAs). Overall, these investments are rather significant and have a great ROI for many investors. So much so, some investors are looking into other areas of real estate investments, such as in dst 1031 property, to see if the same returns are available in that sector too.
NCREIF Property Index – Historical Perspective
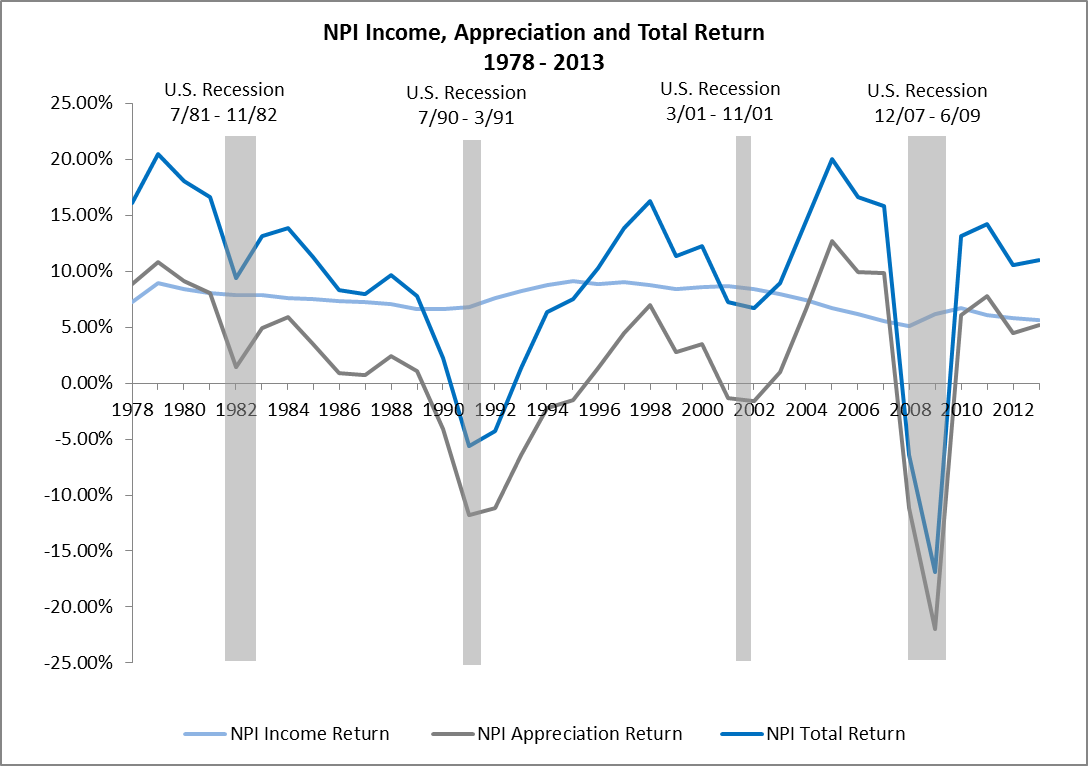
Since its inception in 1978, the NCREIF Property Index has reported a Total Return of 9.15%, made up of an Income Return of 7.52% and an Appreciation Return of 1.54%.
After returning 15.85% in 2007, the NPI Total Return declined to – 6.46% in 2008 and – 16.85% in 2009. Total Return for 2008 was comprised of an Income Return of 5.13% and an Appreciation Return of -11.15%. The impact of The Great Recession was even more pronounced in 2009, with an Income Return of 6.17%, but an Appreciation Return of -21.98%.
In response to the Fed’s first and second rounds of Quantitative Easing, the NPI rebounded in 2010 with a positive return of 13.11% The NPI has been on an impressive run since, posting Total Returns of 14.26%, 10.54% and 10.98% for 2011, 2012 and 2013, respectively. See Figure 1.
Figure 1: NPI Income, Appreciation and Total Return 1978 – 2013
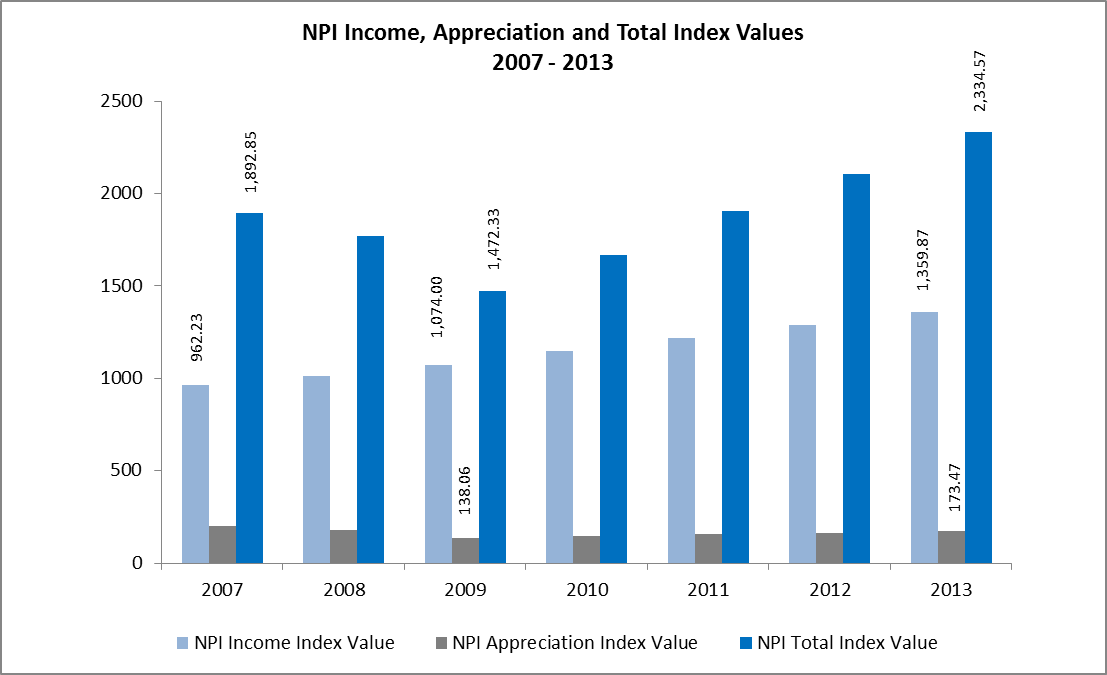
Notwithstanding this impressive run, the Appreciation Index Value for the fourth quarter of 2013 of 173.47 is still 12.9% below the Appreciation Index Value of 199.16 reported for the fourth quarter of 2007. This puts into perspective just how far the Appreciation Index Value had fallen by the end of 2009.
The Income Index Value for the fourth quarter of 2013 of 1359.87, on the other hand, is 41,1% above the fourth quarter of 2007 Income Index Value of 962.3.
Based upon the positive contribution of the Income Index Value, the Total Index Value for the fourth quarter of 2013 of 2,334.57 is 23.3% above the fourth quarter of 2007 Total Index Value of 1,892.85, resulting in an average annual Total Return since the end of 2007 of approximately 3.9%. See Figure 2.
Figure 2: NPI Income, Appreciation and Total Index Values 2007 – 2013
NCREIF Property Index – Forecast
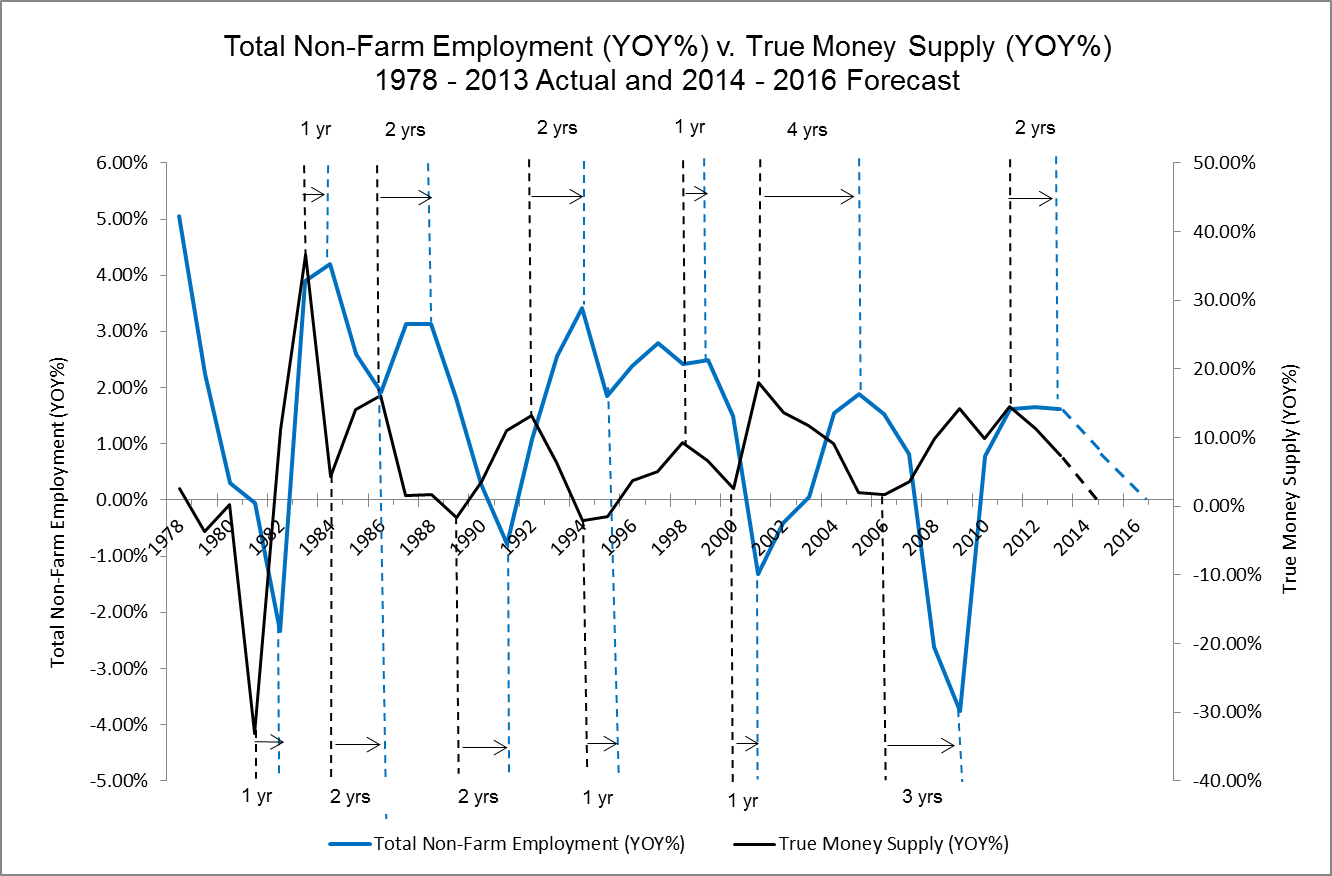
In its February 13th post titled What’s Next For Employment Growth?, RealForecasts.com pointed out that the rate of growth of the True Money Supply (TMS) has been slowing over the past two years and forecasted that it will continue to slow as the Federal Reserve reduces its bond purchases, euphemistically referred to by the Fed as “tapering”. By extrapolating the TMS’s current trajectory into the future, RealForecasts.com forecasted that TMS growth should approach zero in early 2015, setting the stage for the next credit crisis near the end of 2015 or the beginning of 2016.
Based upon a one-year lag between TMS growth and Employment growth since 2009, RealForecasts.com also forecasted that the growth of Employment will begin to decelerate in 2014 and expects it to approach zero in the 2015 to 2016 timeframe. See Figure 3.
Figure 3: Total Non-Farm Employment (YOY%) v. True Money Supply (YOY%) 1978 – 2013 Actual and 2014 – 2016 Forecast
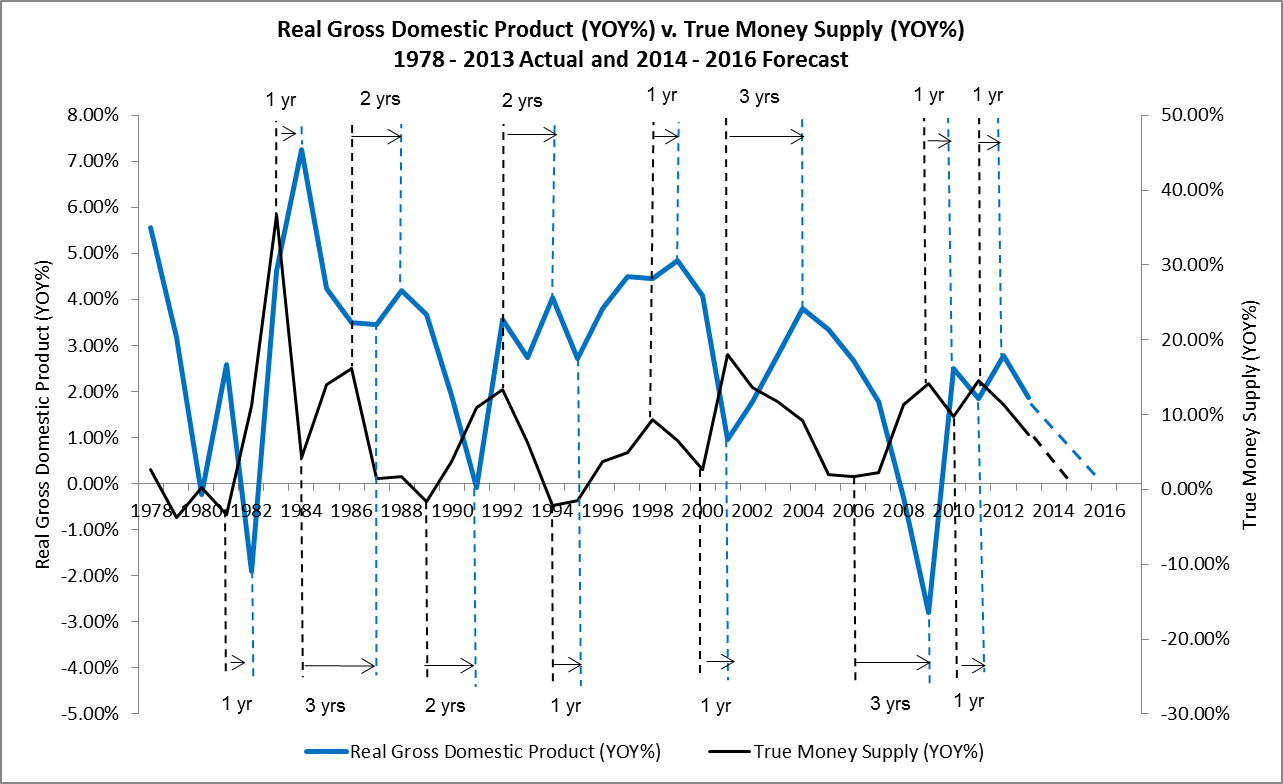
In its March 4th post titled Will GDP Growth Continue To Lose Momentum?, RealForecasts.com identified a similar one-year lag between TMS growth and GDP growth since 2009 and forecasted that the growth rate of GDP should continue to lose momentum and approach zero in early 2016. See Figure 4.
Figure 4: Real Gross Domestic Product (YOY%) v. True Money Supply (YOY%) 1978 – 2013 Actual and 2014 – 2016 Forecast
It won’t be much of a surprise to real estate investment industry veterans that there is a strong correlation between Employment and GDP growth rates and the NPI Returns. After all, employees occupy apartment, office and hotel properties and products fill industrial and retail properties! Those looking to get into real estate investment may want to check out the 1031 exchange broker to get started with this specific area of investment, diversify their portfolio, and improve their income-growth potential. Of course, there are plenty of other tools to invest in if you are looking to get your real estate business off the ground. These can be tools like CRM or lead generation. You can also look in to Real Estate Back Office to help you organise your transactions, and to streamline your productivity.
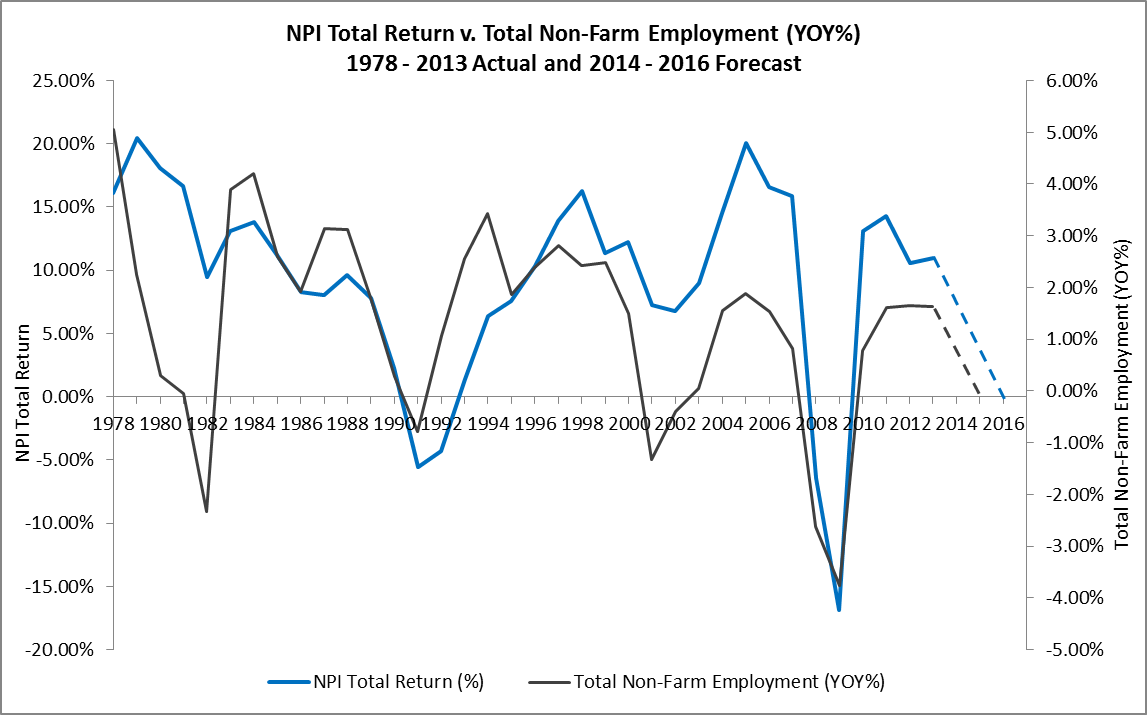
The correlation between NPI Total Return and the Employment growth rate is illustrated in Figure 5. The peaks and troughs of the NPI Total Return closely follow the peaks and troughs of YOY change in Employment, with a slight lag during some time periods.
Figure 5: NPI Total Return v. Total Non-Farm Employment (YOY%) 1978 – 2013 Actual and 2014 – 2016 Forecast
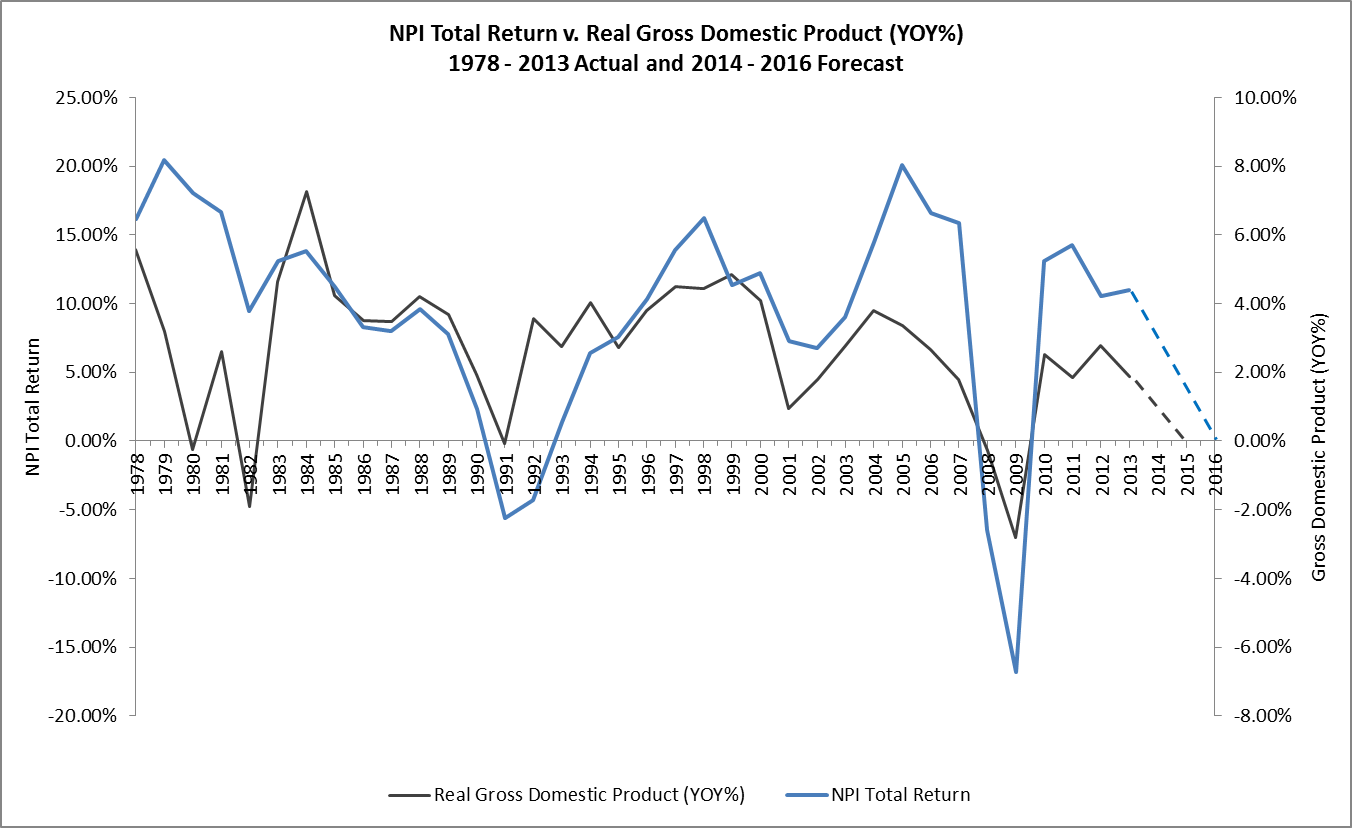
Similarly, the correlation between NPI Total Return and the GDP growth rate is illustrated in Figure 6. The peaks and troughs of the NPI Total Return closely follow the peaks and troughs of the YOY change in Real Gross Domestic Product, but without a lag.
Figure 6: NPI Total Return v. Real Gross Domestic Product (YOY%) 1978 – 2013 Actual and 2014 – 2016 Forecast
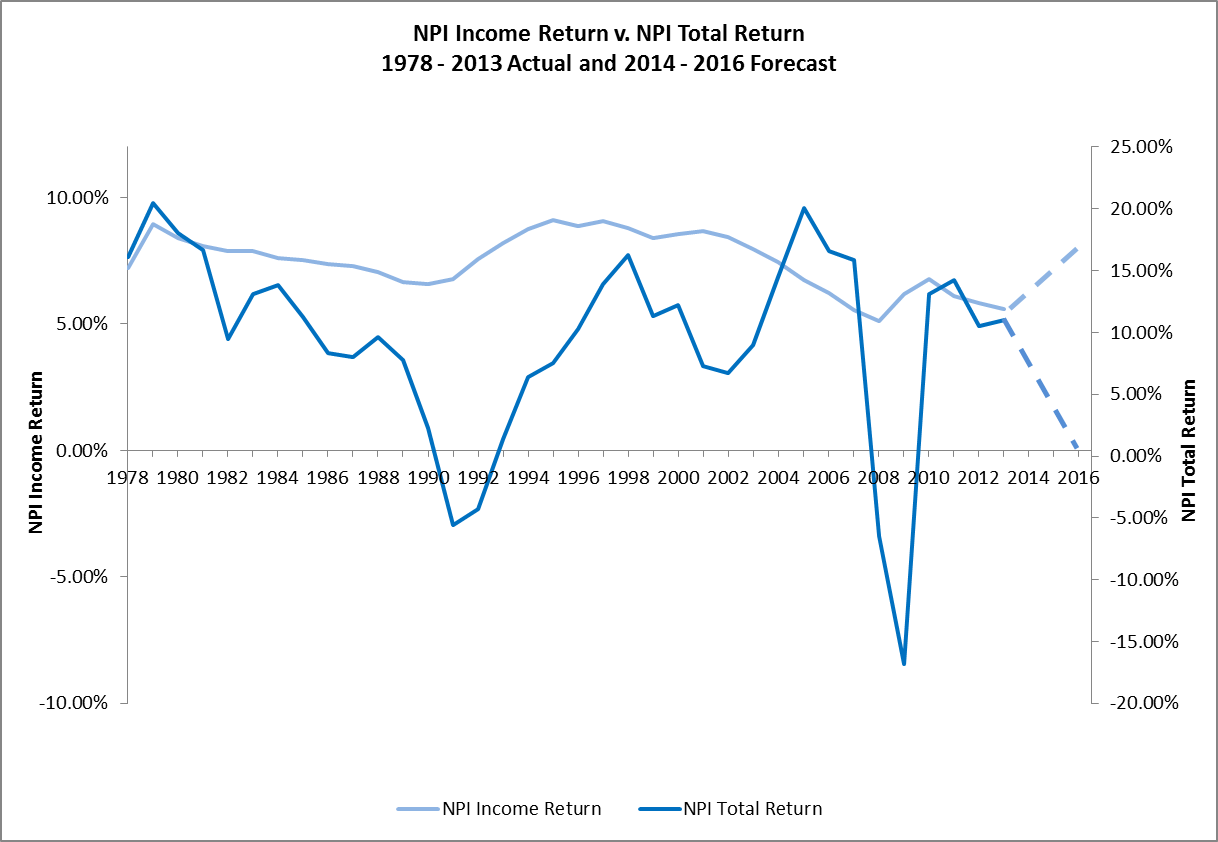
Finally, shortly after the NPI Total Return begins a cyclical decline, the NPI Income Return turns upward. Real estate values and cap rates — for which the NPI Income return can be viewed as a proxy – are inversely related. This occurred during 2008 and 2009 and would have continued in 2010 and beyond if the Fed had not forced yields back down through its quantitative easing policy. Now that the Fed is reducing its bond purchases with the aim of ending quantitative later this year, the NPI Income Return will likely resume the trajectory it was on before the Fed’s intervention. See Figure 7.
Figure 7: NPI Income Return v. NPI Total Return 1978 – 2013 Actual and 2014 – 2016 Forecast
As with the forecasts contained in RealForecasts.com’s two previous posts, the current forecast is predicated on the Fed’s continuation of its current policy to gradually reduce the amount of bond purchases until it ends quantitative easing later this year. Because continuation of the Fed’s current policy is likely, this forecast represents RealForecasts.com’s base case scenario. To prepare for possible changes in the TMS, Employment and GDP growth rates — and the NCREIF Property Index returns — RealForecast.com recommends that readers continue to keep a close watch on the Fed’s actions as 2014 unfolds.
Many thanks to J. Michael Pollaro, author of The Contrarian Take, for the TMS data used to construct the charts in this article.


Pingback: Where Are The Employment Markets In Their Cycles? | RealForecasts.com
Pingback: What Does The Dramatic Deceleration In The Growth Of The True Money Supply Mean For Real Estate Investors? | RealForecasts.com