By Jeffrey J. Peshut
September 14, 2015
In its last post, Can Real Estate Investors Manage Through The Boom/Bust Cycle?, RealForecasts.com presented alternative strategies that real estate investors can employ to manage through the boom/bust cycle, depending upon where the real estate capital markets and real estate property markets are in their cycles. That of course begs the question, “Where are the real estate capital markets and real estate property markets in their cycles today?” This post will address the question of where one sector of the real estate capital markets — the real estate credit markets — are in their cycles.
Real Estate Credit Market Cycles
The real estate credit markets can be divided into three separate categories — commercial mortgage debt, multi-family residential mortgage debt and and single-family residential mortgage debt. RealForecasts.com uses changes in the level of mortgage debt outstanding to track the cycle for each category.
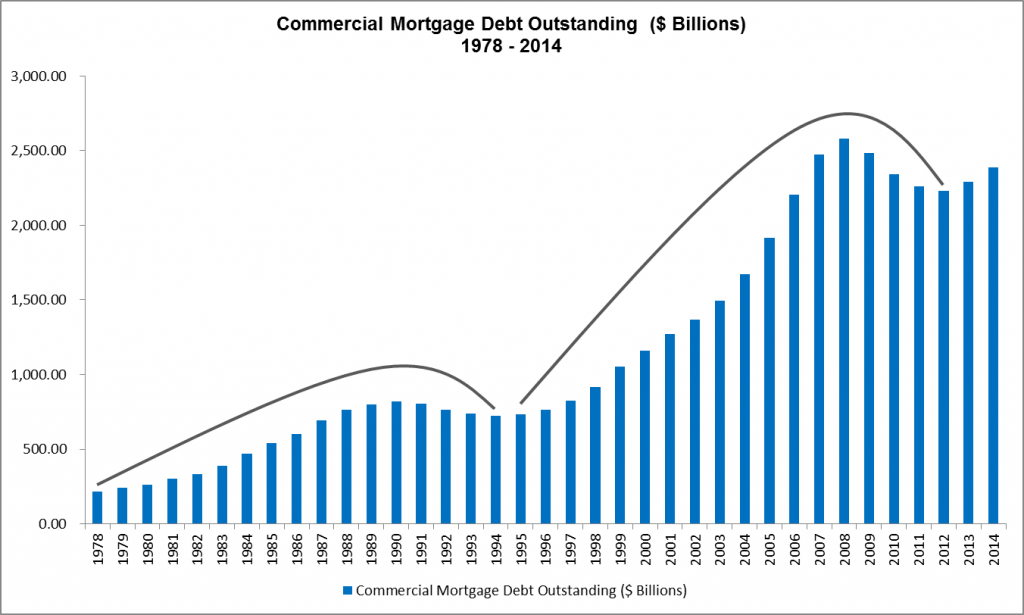
For example, Figure 1 shows commercial mortgage debt outstanding from 1978 to 2014. The last cycle for commercial mortgage debt began in 1995 at a level of $733.8 billion before peaking in 2008 at a level of $2.58 trillion. As the supply of credit contracted after the Great Financial Crisis, commercial mortgage debt outstanding also contracted, reaching a trough of $2.23 trillion — and the end of the cycle — in 2012. Since the start of the current cycle in 2013, commercial mortgage debt outstanding has increased to $2.39 trillion, but has yet to recover to its 2008 peak.
Figure 1: Commercial Mortgage Debt Outstanding ($ Billions) 1978 – 2014
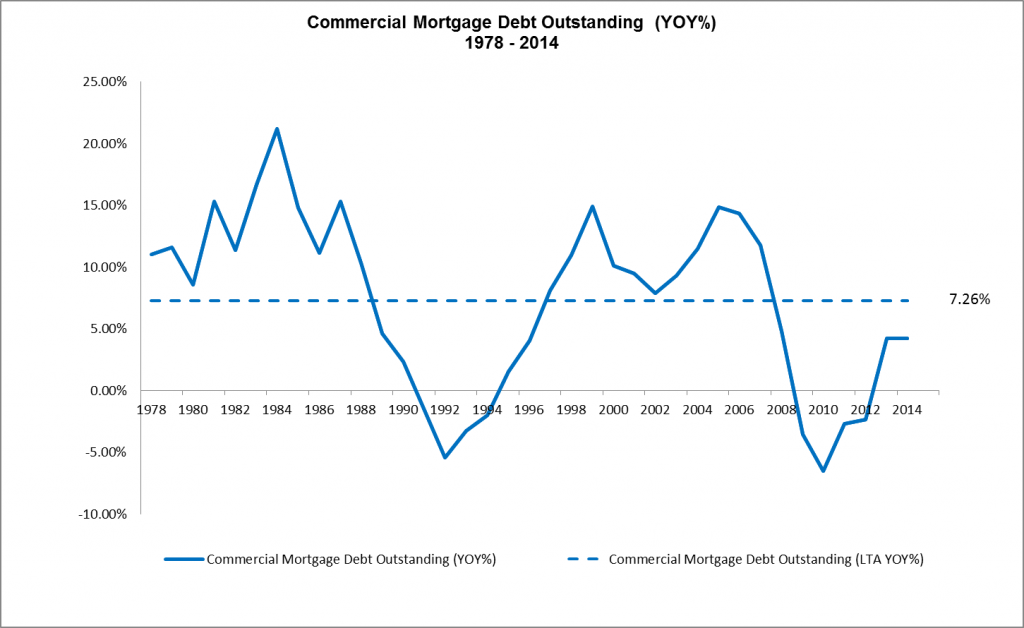
The year-over-year growth rate of commercial mortgage debt outstanding since 1978 is shown in Figure 2. The rate of growth averaged 7.26% from 1978 to 2014. but accelerated to almost 15% in both 1999 and 2005.
Figure 2: Commercial Mortgage Debt Outstanding (YOY%) 1978 – 2014
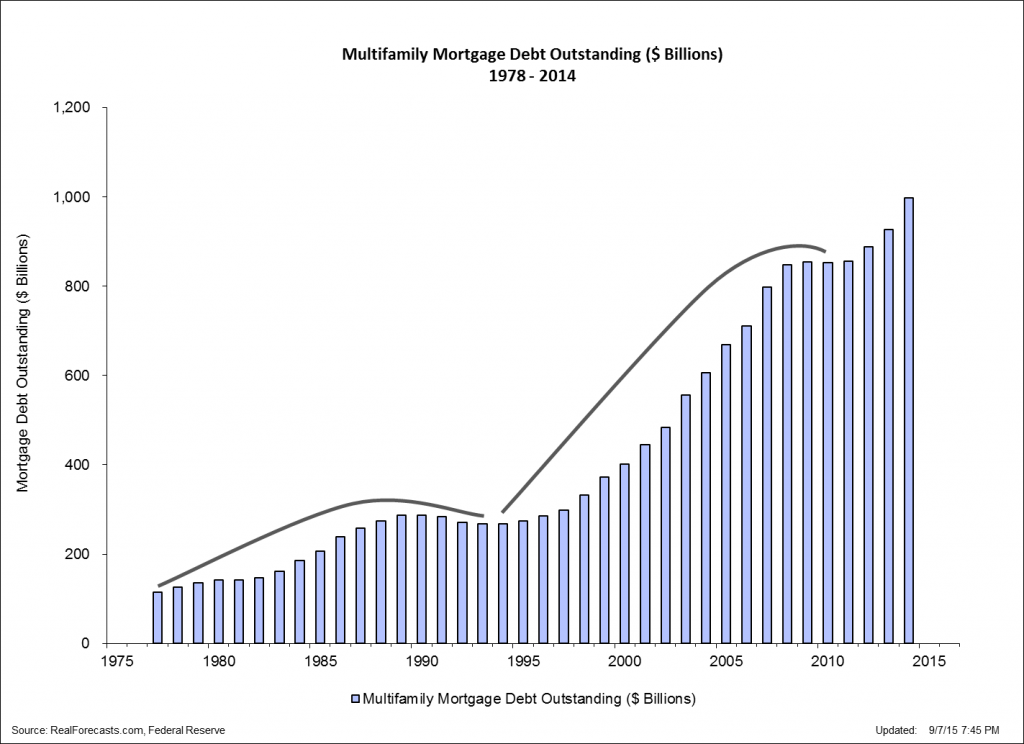
Figure 3 presents multifamily mortgage debt outstanding between 1978 and 2014. The last cycle for multifamily mortgage debt began in 1994 at a level of $268.2 billion and increased to a peak of $855.2 billion in 2009. After the Great Financial Crisis, however, multifamily mortgage debt outstanding decreased only slightly to $852.2 billion in 2010. Multifamily mortgage debt began increasing again — and the new cycle began — in 2011 and had reached $998.6 billion as of the end of 2014.
Figure 3: Multifamily Mortgage Debt Outstanding ($ Billions) 1978 – 2014
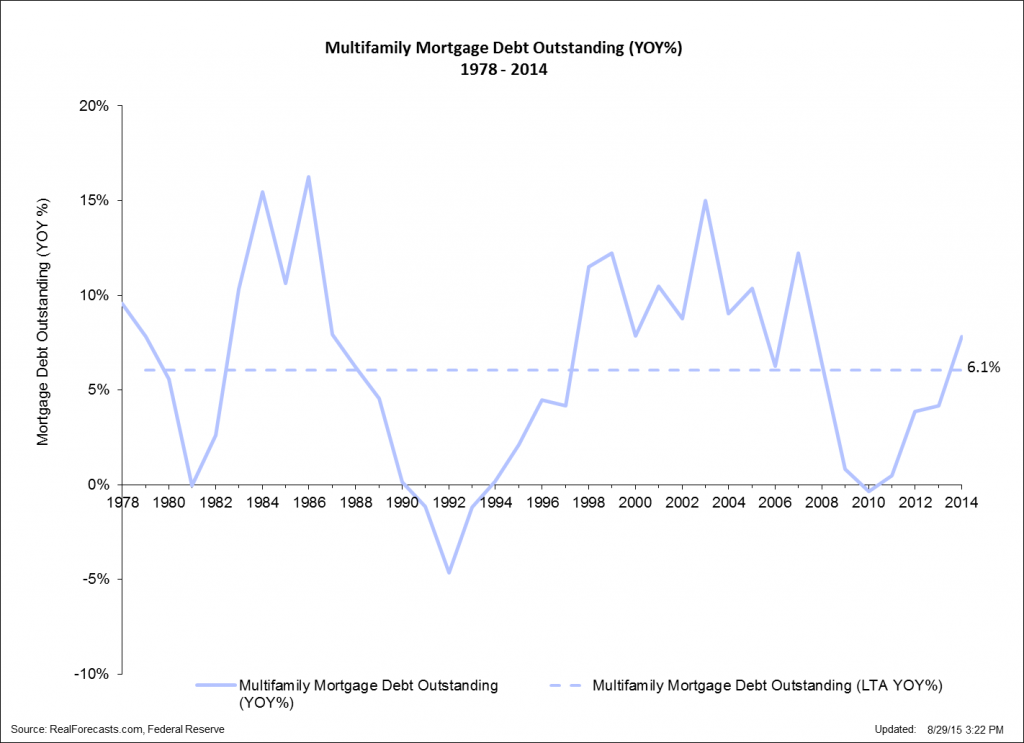
Figure 4 presents the year-over-year growth rate of multifamily mortgage debt since 1978. Although the rate of growth averaged only 6.1% from 1978 to 2014. growth accelerated to 12.2% in 1999 and 2007 and 15% in 2003.
Figure 4: Multifamily Mortgage Debt Outstanding (YOY%) 1978 – 2014
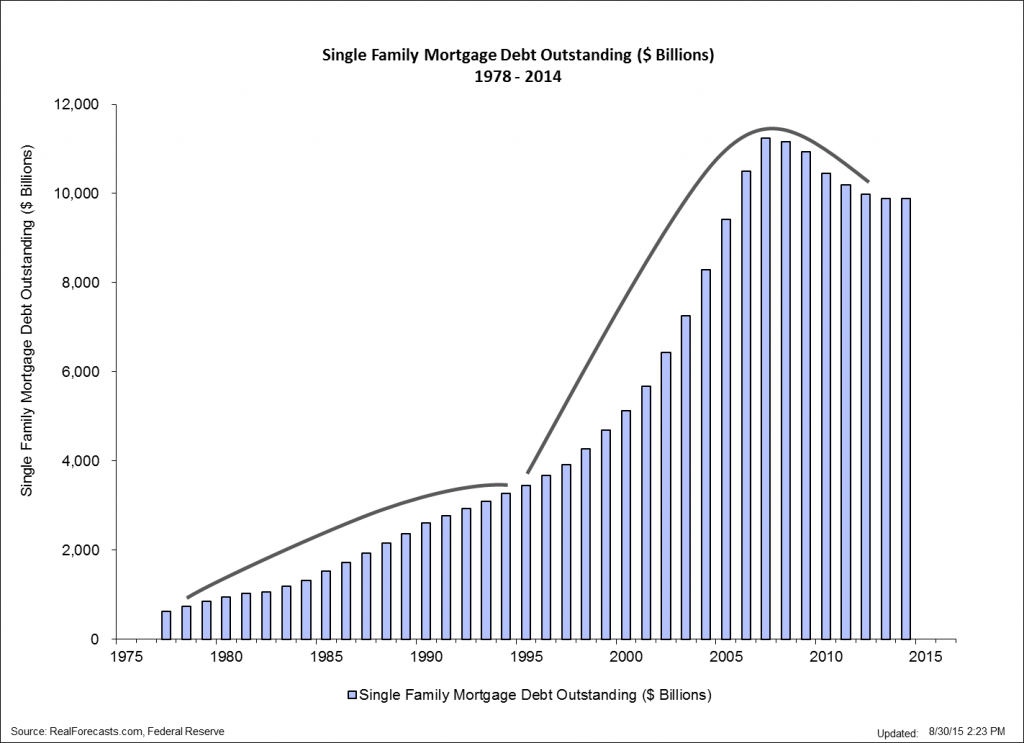
Finally, Figure 5 shows single family mortgage debt outstanding from 1978 to 2014. The most recent cycle for single family mortgage debt began in 1995 at a level of $3.45 trillion before peaking in 2007 at a level of $11.24 trillion — an increase of 226%. Single family mortgage debt outstanding contracted significantly after the Great Financial Crisis, decreasing to $9.89 trillion at the end of 2014. At this point, it’s not clear whether the last cycle has ended and the new cycle has begun. Regardless, it will still be a number of years before single family mortgage debt outstanding returns to its 2007 peak.
Figure 5: Single Family Mortgage Debt Outstanding ($ Billions) 1978 – 2014
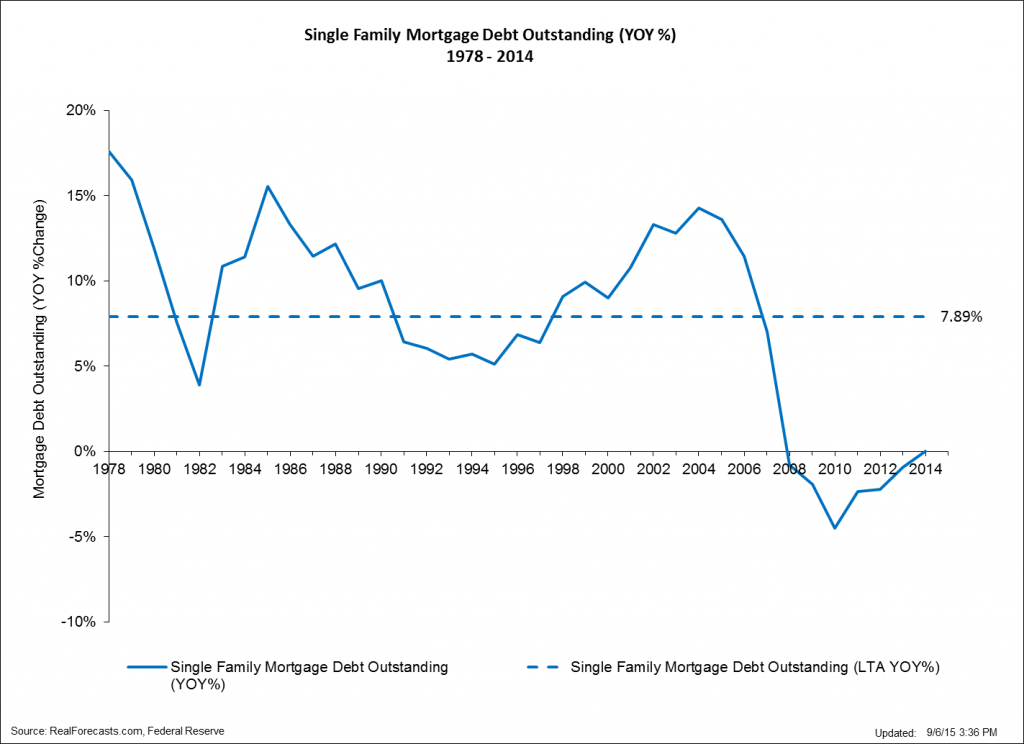
Figure 6 presents the year-over-year growth rate of single family mortgage debt outstanding since 1978. Not only did the rate of growth average almost 8% from 1978 to 2014. growth accelerated to as high as 15.5% in 1985 and 14.3% in 2004. Perhaps even more importantly, in the last year of the cycle that ended in 1995, single family mortgage debt outstanding never contracted and in fact grew at a rate of 5.1%.
Figure 6: Single Family Mortgage Debt Outstanding (YOY%) 1978 – 2014
Comparing Figure 6 to Figure 4 and Figure 2 shows that the multifamily mortgage market is much farther along in its current cycle than either the commercial mortgage market or the single family mortgage market. The marked difference in size between the single family mortgage debt market and the multifamily mortgage debt market — the single family mortgage debt market is approximately 10 times the size of the multifamily mortgage debt market — may help to explain the accelerated growth in multifamily mortgage debt outstanding since 2010.
Government Sponsored Enterprises (GSE’s) like Fannie Mae and Freddie Mac are not only the largest source of lending capital for single-family homes, but they are also the largest source of lending capital for apartment homes. The Fed’s attempt to re-inflate the single-family residential market by acquiring residential mortgage-backed securities from Fannie Mae and Freddie Mac has arguably had the unintended consequence of flooding the multifamily residential market with an over-abundance of inexpensive mortgage debt. This in turn could result in the over-building and over-supply of apartment homes.
Real Estate Credit Market Cycles and Cap Rate Cycles
Recently, real estate pundits have been speculating about the impact of the Fed’s expected increase in the Fed Funds Target Rate on real estate mortgage rates and real estate cap rates. Mostly overlooked in this discussion is the impact of an increase in the level of mortgage debt outstanding on cap rates.
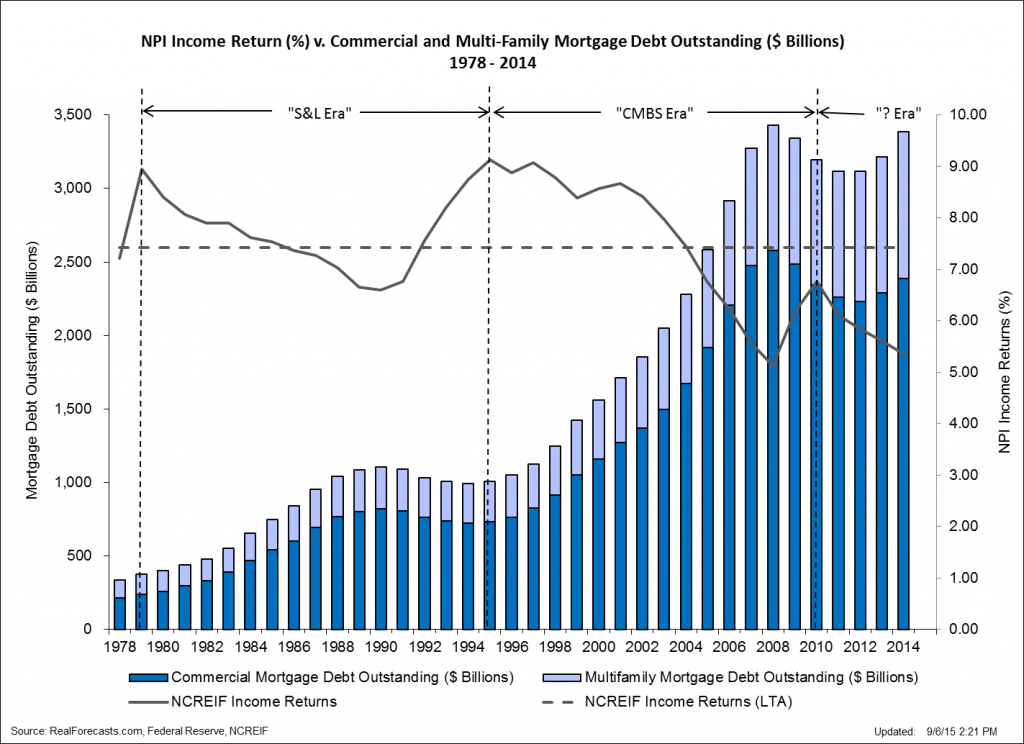
To that point, Figure 7 compares the NCREIF Property Index (NPI) Income Return — as a proxy for cap rates on commercial and multifamily properties — to commercial and multifamily mortgage debt outstanding from 1978 to 2014. Note the strong inverse correlation between the NPI Income Return and the level of commercial and multifamily residential mortgage debt outstanding.
For example, as commercial and multifamily mortgage debt outstanding increased from $374.4 billion in 1979 to $1.11 trillion in 1990, the NPI Income Return decreased from 8.95% to 6.59%. Then, as commercial and multifamily mortgage debt outstanding contracted from $1.11 trillion in 1990 to $990.9 billion in 1994, the NPI Income Return increased from 6.59% in 1990 to 9.13% in 1995. The credit cycle during the 17-year period from 1979 to 1995 has been referred to as the “S&L Era” to reflect the new sources of commercial and multifamily mortgage debt outstanding during that time frame.
As commercial and multifamily mortgage debt outstanding increased from $1.08 trillion in 1995 to $3.4 trillion in 2008, the NPI Income Return decreased from 9.13% to 5.13%. Then, as commercial and multifamily mortgage debt outstanding contracted from $3.4 trillion in 2008 to $3.1 trillion in 2011, the NPI Income Return increased from 5.13% in 2008 to 6.76% in 2010. The credit cycle during the 16-year period from 1995 to 2010 has been referred to as the “CMBS Era”, again to reflect the new sources of commercial and multifamily mortgage debt outstanding during that period.
Since the beginning of the current real estate credit cycle, commercial and multifamily mortgage debt outstanding has increased from $3.12 trillion in 2011 to $3.38 trillion in 2014. In turn, the NPI Income Return has decreased from 6.76% in 2010 to 5.36% in 2014.
Figure 7: NPI Income Return (%) v. Commercial and Multi-Family Mortgage Debt Outstanding 1978 – 2014
Although it is hard to believe that it can go much lower, this analysis suggests that the NPI Income Return will in fact continue to trend downward as commercial and multifamily mortgage debt outstanding continues to increase during the current real estate credit cycle. It’s less clear at this point, however, what will be the new sources of commercial and multifamily mortgage debt outstanding during the current cycle. Those that are suggesting that this will become know as the “Shadow Banking Era” — referring to non-chartered lending institutions — could be on the right track.
